Websocket Tutorial
The complete Python source code for this example can be found here: https://github.com/epiviz/epivizpy.
One of the key features of Epiviz is allowing users to plug in new data on the fly, using Data Provider plugins. One powerful such plugin is the WebSocket data provider. This data provider offers an interface between Epiviz and any programming environment that supports WebSocket connections. In R there is already a Bioconductor library that supports communication with Epiviz through WebSockets, called Epivizr.
In this tutorial, we go over the essentials of creating a new WebSocket endpoint for Epiviz. We choose Python as an example programming environment, to emphasize the flexibility and power of the Epiviz framework. We create a simple program with the same functionality as epiviz.plugins.data.MyDataProvider, from the Data Provider Plugin Tutorial.
To connect to Epiviz using the WebSocket API
To connect to the Epiviz WebSocket API, you need a programming environment that supports the WebSocket protocol (like R, Python, Java EE, etc). In R, you can use the Epivizr Bioconductor package. For this demo, we create an example in Python (source code available here). The same functionality can be replicated in any other language as long as the API is respected.
- In Python, one library that provides access to the WebSocket protocol is tornado.
First we implement a subclass of
tornado.websocket.WebSocketHandler.
Example
import simplejson
import tornado.websocket

class EpiVizPyEndpoint(tornado.websocket.WebSocketHandler):

    def __init__(self, *args, **kwargs):
        super(EpiVizPyEndpoint, self).__init__(*args, **kwargs)

    def open(self):
        print 'new connection'

    def on_message(self, json_message):
        print 'message received %s' % json_message
        message = simplejson.loads(json_message)

    def on_close(self):
        print 'connection closed'
- Create a class that can parse request strings (this is optional, but will make our work a lot easier). As described in the Data Provider Plugin Tutorial, there are two types of request actions in Epiviz: Server Actions and UI Actions.
Example
from enum import Enum

class Request(object):

    class Action(Enum):
        # Server actions
        GET_ROWS = 'getRows'
        GET_VALUES = 'getValues'
        GET_MEASUREMENTS = 'getMeasurements'
        SEARCH = 'search'
        GET_SEQINFOS = 'getSeqInfos'
        SAVE_WORKSPACE = 'saveWorkspace'
        GET_WORKSPACES = 'getWorkspaces'

        # UI actions
        ADD_MEASUREMENTS = 'addMeasurements'
        REMOVE_MEASUREMENTS = 'removeMeasurements'
        ADD_SEQINFOS = 'addSeqInfos'
        REMOVE_SEQNAMES = 'removeSeqNames'
        ADD_CHART = 'addChart'
        REMOVE_CHART = 'removeChart'
        CLEAR_DATASOURCE_GROUP_CACHE = 'clearDatasourceGroupCache'
        FLUSH_CACHE = 'flushCache'
        NAVIGATE = 'navigate'

    def __init__(self, request_id, args):
        '''
        :param request_id: number
        :param args: map<string, string>
        '''
        self._id = request_id
        self._args = args

    def id(self):
        return self._id

    def get(self, arg):
        if arg in self._args:
            return self._args[arg]

        return None

    @staticmethod
    def from_raw_object(o):
        return Request(o['requestId'], o['data'])
- In our
EpivizPyEndpointclass, create a method to handle the Server actions. And methods for the actions. The functionality is that for any request, we return a set of blocks of fixed length of100at every1000base pairs. The value associated to them is generated randomly between-5and25.
Complete Example
import simplejson
import math
import random

import tornado.websocket

from epiviz.websocket.Request import Request
from epiviz.websocket.Response import Response


class EpiVizPyEndpoint(tornado.websocket.WebSocketHandler):

    def __init__(self, *args, **kwargs):
        super(EpiVizPyEndpoint, self).__init__(*args, **kwargs)

        self._mock_measurement = {
          'id': 'py_column',
          'name': 'Python Measurement',
          'type': 'feature',
          'datasourceId': 'py_datasource',
          'datasourceGroup': 'py_datasourcegroup',
          'defaultChartType': 'Line Track',
          'annotation': None,
          'minValue': -5,
          'maxValue': 25,
          'metadata': ['py_metadata']
        }

    def open(self):
        print 'new connection'

    def on_message(self, json_message):
        print 'message received %s' % json_message
        message = simplejson.loads(json_message)

        if message['type'] == 'request':
            request = Request.from_raw_object(message)
            self._handle_request(request)

    def on_close(self):
        print 'connection closed'

    def _handle_request(self, request):
        action = request.get('action')

        # switch(action)
        response = {
            Request.Action.GET_MEASUREMENTS: lambda: self._get_measurements(request.id()),
            Request.Action.GET_ROWS: lambda: self._get_rows(request.id(), request.get('datasource'), request.get('chr'), request.get('start'), request.get('end'), request.get('metadata')),
            Request.Action.GET_VALUES: lambda: self._get_values(request.id(), request.get('measurement'), request.get('datasource'), request.get('chr'), request.get('start'), request.get('end')),
            Request.Action.GET_SEQINFOS: lambda: self._get_seqinfos(request.id()),
            Request.Action.SEARCH: lambda: self._search(request.id(), request.get('q'), request.get('maxResults'))
        }[action]()


        message = response.to_json()
        print 'response %s' % message
        self.write_message(message)

    # Request handlers

    def _get_measurements(self, request_id):
        '''
        Returns Response
        '''
        return Response(request_id, {
          'id': [self._mock_measurement['id']],
          'name': [self._mock_measurement['name']],
          'type': [self._mock_measurement['type']],
          'datasourceId': [self._mock_measurement['datasourceId']],
          'datasourceGroup': [self._mock_measurement['datasourceGroup']],
          'defaultChartType': [self._mock_measurement['defaultChartType']],
          'annotation': [self._mock_measurement['annotation']],
          'minValue': [self._mock_measurement['minValue']],
          'maxValue': [self._mock_measurement['maxValue']],
          'metadata': [self._mock_measurement['metadata']]
        })

    def _get_rows(self, request_id, datasource, seq_name, start, end, metadata):
        '''
        :param datasource: string
        :param seq_name: string
        :param start: number
        :param end: number
        :param metadata: string[] A list of column names for which to retrieve the values
        Returns response
        '''
        # Return a genomic range of 100 base pairs every 1000 base pairs
        step, width = 1000, 100

        globalStartIndex = math.floor((start - 1) / step) + 1
        firstStart = globalStartIndex * step + 1
        firstEnd = firstStart + width

        if firstEnd < start:
            firstStart += step
            firstEnd += step

        if firstStart >= end:
            # Nothing to return
            return Response(request_id, {
              'values': { 'id': [], 'start': [], 'end': [], 'strand': [], 'metadata': { 'py_metadata': [] } },
              'globalStartIndex': None,
              'useOffset': False
            })

        ids = []
        starts = []
        ends = []
        strands = '*'
        py_metadata = []

        globalIndex = globalStartIndex
        s = firstStart

        while s < end:
            ids.append(globalIndex)
            starts.append(s)
            ends.append(s + width)
            py_metadata.append(self._random_str(5)) # Random string
            globalIndex += 1
            s += step

        return Response(request_id, {
          'values': { 'id': ids, 'start': starts, 'end': ends, 'strand': strands, 'metadata':{ 'py_metadata': py_metadata } },
          'globalStartIndex': globalStartIndex,
          'useOffset': False
        })

    def _get_values(self, request_id, measurement, datasource, seq_name, start, end):
        '''
        :param measurement: string, column name in the datasource that contains requested values
        :param datasource: string
        :param seq_name: string
        :param start: number
        :param end: number
        Returns response
        '''
        # Return a genomic range of 100 base pairs every 1000 base pairs
        step, width = 1000, 100

        globalStartIndex = math.floor((start - 1) / step) + 1
        firstStart = globalStartIndex * step + 1
        firstEnd = firstStart + width

        if firstEnd < start:
            firstStart += step
            firstEnd += step

        if firstStart >= end:
            # Nothing to return
            return Response(request_id, {
              'values': [],
              'globalStartIndex': None,
            })

        values = []
        globalIndex = globalStartIndex
        s = firstStart
        m = self._mock_measurement
        while s < end:
            v = random.random() * (m['maxValue'] - m['minValue']) + m['minValue']
            values.append(v)
            globalIndex += 1
            s += step

        return Response(request_id, {
          'values': values,
          'globalStartIndex': globalStartIndex
        })

    def _get_seqinfos(self, request_id):
        '''
        Returns response
        '''
        return Response(request_id, [['chr1', 1, 248956422], ['pyChr', 1, 1000000000]])

    def _search(self, request_id, query, max_results):
        '''
        :param query: string
        :param max_results: number
        Returns response
        '''
        return Response(request_id, [])


    def _random_str(self, size):
        chars = '0123456789abcdefghijklmnopqrstuvwxyzABCDEFGHIJKLMNOPQRSTUVWXYZ'
        result = ''

        for _ in range(size):
            result += chars[random.randint(0, len(chars) - 1)]

        return result
- Create a class that instantiates the WebSocket endpoint in another thread so the main thread is kept unblocked.
Example
import threading

import tornado.httpserver
import tornado.ioloop
import tornado.web

from epiviz.websocket.EpiVizPyEndpoint import EpiVizPyEndpoint


class EpiVizPy(object):
    def __init__(self, server_path=r'/ws'):
        self._thread = None
        self._server = None
        self._application = tornado.web.Application([(server_path, EpiVizPyEndpoint)])

    def start(self, port=8888):
        self.stop()
        self._thread = threading.Thread(target=lambda: self._listen(port)).start()

    def stop(self):
        if self._server != None:
            tornado.ioloop.IOLoop.instance().stop()
            self._server = None
            self._thread = None

    def _listen(self, port):
        self._server = tornado.httpserver.HTTPServer(self._application)
        self._server.listen(port)
        tornado.ioloop.IOLoop.instance().start()
-
Finally create a main program that runs the whole thing.
Example
from sys import stdin from epiviz.websocket.EpiVizPy import EpiVizPy if __name__ == '__main__': epivizpy = EpiVizPy() epivizpy.start() print 'press enter to stop' userinput = stdin.readline() epivizpy.stop() print 'stopped' -
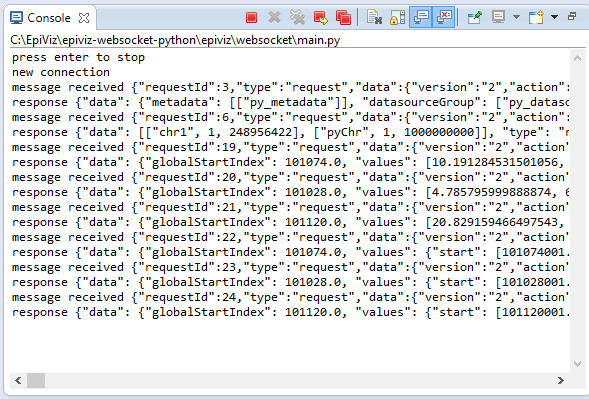
Run it, and open an Epiviz instance, using the URL argument
websocket-host[]=ws://localhost:8888/ws: http://epiviz.cbcb.umd.edu/4/?websocket-host[]=ws://localhost:8888/ws.
Python console

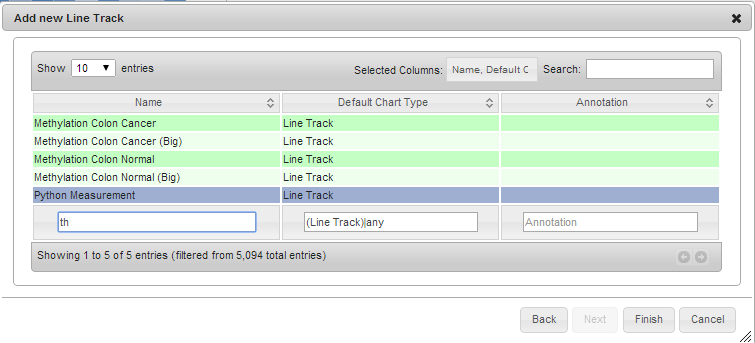
New measurement in menus

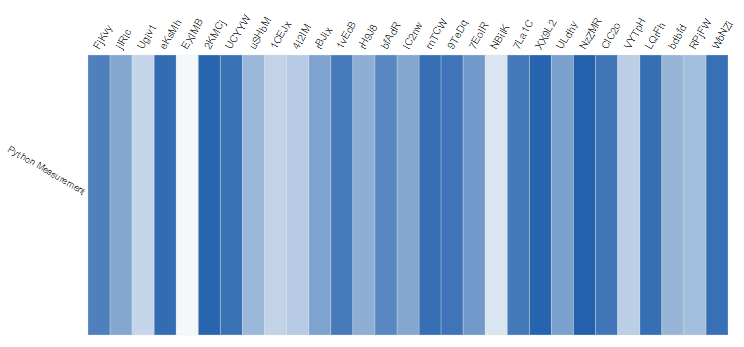
Different charts showing the measurement defined in Python


The complete Python source code for this example can be found here: https://github.com/epiviz/epivizpy.