External Scripts and Plugins
Table of Contents
- Plugging in external scripts and settings
- Creating a new Chart Plugin
- Creating a new Data Provider Plugin
Epiviz allows users to plug in new visualizations and data providers on the fly, by using the Charts API and Data Providers API, without the need of downloading or installing anything on the local machine. The new visualizations and data providers can be used immediately, alongside existing ones. Also, users can override the default settings of the UI to adapt it to their own needs. Here’s how to do it:
- Create a plugin script. Whether it’s a new visualization, new data provider, or simply changing the default
settings of
Epiviz, you need to write aJavaScriptscript for it.
Example
A very simple example is a script that overrides some of the {{ site.epiviz }} default settings. A copy of the default settings
in Epiviz can be found here: http://epiviz.cbcb.umd.edu/4/src/epiviz/default-settings.js.
Choose a subset of settings you want to modify. In our example, we change the default colors for the Scatter Plot
and set the initial circle radius for data points to be 0.02, instead of 0.01, which is the default. Also, we
change the settings so that Epiviz can only display scatter plots and genes tracks.
Epiviz 4 or 3:
// Create a new color palette
var myPalette = new epiviz.ui.charts.ColorPalette(['#ed2d2e', '#008c47'], 'My Palette', 'my-palette');
epiviz.Config.SETTINGS.colorPalettes.push(myPalette);

// Set the default colors for the Scatter Plot to '#ed2d2e' and '#008c47'
epiviz.Config.SETTINGS.chartSettings['epiviz.plugins.charts.ScatterPlot']['colors'] = 'my-palette';

// Set the Scatter Plot custom setting circleRadiusRatio to 0.02
epiviz.Config.SETTINGS.chartCustomSettings['epiviz.plugins.charts.ScatterPlot']['circleRadiusRatio'] = 0.02;

// Tell EpiViz to only show two types of charts: Scatter Plots and Genes Tracks
epiviz.Config.SETTINGS.chartTypes = [
  'epiviz.plugins.charts.ScatterPlotType',
  'epiviz.plugins.charts.GenesTrackType'];
Epiviz 2:
// Set the default colors for the Scatter Plot to '#ed2d2e' and '#008c47'
epiviz.EpiViz.SETTINGS.chartSettings['epiviz.plugins.charts.ScatterPlot']['colors'] = new epiviz.ui.charts.ColorPalette(['#ed2d2e', '#008c47']);

// Set the Scatter Plot custom setting circleRadiusRatio to 0.02
epiviz.EpiViz.SETTINGS.chartCustomSettings['epiviz.plugins.charts.ScatterPlot']['circleRadiusRatio'] = 0.02;

// Tell EpiViz to only show two types of charts: Scatter Plots and Genes Tracks
epiviz.EpiViz.SETTINGS.chartTypes = ['epiviz.plugins.charts.ScatterPlotType', 'epiviz.plugins.charts.GenesTrackType'];
- Epiviz also implements the GitHub Gist API, allowing users to create and use Gist as plugins (see here a short tutorial on how to create a Gist script).
Example: For the purpose of this tutorial, we created a Gist script with the same contents here
- (Epiviz 4|3): http://gist.github.com/fa247476e6d9b4efb76a
- (Epiviz 2): http://gist.github.com/7851244d2d9a9996403a.
- Open {% link Epiviz http://epiviz.cbbc.umd.edu/4 %} using the id of the GitHub Gist script as value for the
gistargument. Note: thegistargument represents an array, so that multiple scripts can be provided at once. Thus, the formatgist[]=<gist id>should be used. In background, Epiviz uses the GitHub Gist API to retrieve the scripts using the given id, and use plug them in at start-up.
- Example: (Epiviz 4) [http://epiviz.cbcb.umd.edu/4/?ws=wjRtqAK3GCd&settings=default&gist[]=fa247476e6d9b4efb76a]({{ site.epivizUiMain }}?ws=wjRtqAK3GCd&settings=default&gist[]=fa247476e6d9b4efb76a)
- Example: (Epiviz 3) [http://epiviz.cbcb.umd.edu/3/?ws=wjRtqAK3GCd&settings=default&gist[]=fa247476e6d9b4efb76a]({{ site.epivizUiMain }}?ws=wjRtqAK3GCd&settings=default&gist[]=fa247476e6d9b4efb76a)
- Example: (Epiviz 2) [http://epiviz.cbcb.umd.edu/2/?ws=wjRtqAK3GCd&settings=default&gist[]=7851244d2d9a9996403a]({{ site.epiviz2UiMain }}?ws=wjRtqAK3GCd&settings=default&gist[]=7851244d2d9a9996403a)
Overriding settings
In Epiviz, there are a few ways to override the default settings.
- The first one, demonstrated earlier, is to provide a
gistGET argument. - The second one, is by creating an entire settings file to override the existing default settings. This works similar
to the first method, only differing from it by the fact that it uses cookies to preserve the latest used settings. The
GET arguments used for this are
settingsandsettingsGist. To revert to the default {{ site.epiviz }} settings, one should open (http://epiviz.cbcb.umd.edu/4/)[http://epiviz.cbcb.umd.edu/4/] withsettings=default.
In the tutorial examples for Creating a new chart plugin and Creating a new data provider plugin we provide more examples of plugging in various scripts and settings.
- Create a class for the actual visualization
Example
goog.provide('epiviz.plugins.charts.MyTrack');

/**
 * @constructor
 */
epiviz.plugins.charts.MyTrack = function() {
};
- Inherit either
epiviz.ui.charts.Trackorepiviz.ui.charts.Plot(depending on display type)
Example
goog.provide('epiviz.plugins.charts.MyTrack');

/**
 * @param id
 * @param {jQuery} container
 * @param {epiviz.ui.charts.ChartProperties} properties
 * @extends {epiviz.ui.charts.Track}
 * @constructor
 */
epiviz.plugins.charts.MyTrack = function(id, container, properties) {
  // Call superclass constructor
  epiviz.ui.charts.Track.call(this, id, container, properties);

  this._initialize();
};

/*
 * Copy methods from upper class
 */
epiviz.plugins.charts.MyTrack.prototype = epiviz.utils.mapCopy(epiviz.ui.charts.Track.prototype);
epiviz.plugins.charts.MyTrack.constructor = epiviz.plugins.charts.MyTrack;


/**
 * @param {epiviz.datatypes.GenomicRange} [range]
 * @param {epiviz.measurements.MeasurementHashtable.<epiviz.datatypes.GenomicDataMeasurementWrapper>} [data]
 * @param {number} [slide]
 * @param {number} [zoom]
 * @returns {Array.<epiviz.ui.charts.UiObject>} The objects drawn
 */
epiviz.plugins.charts.MyTrack.prototype.draw = function(range, data, slide, zoom) {
  return epiviz.ui.charts.Chart.prototype.draw.call(this, range, data, slide, zoom);
};

/**
 * @returns {string}
 */
epiviz.plugins.charts.MyTrack.prototype.chartTypeName = function() {
  return 'epiviz.plugins.charts.MyTrack';
};
- Implement the
draw()method
Example
/**
 * @param {epiviz.datatypes.GenomicRange} [range]
 * @param {epiviz.measurements.MeasurementHashtable.<epiviz.datatypes.GenomicDataMeasurementWrapper>} [data]
 * @param {number} [slide]
 * @param {number} [zoom]
 * @returns {Array.<epiviz.ui.charts.UiObject>} The objects drawn
 */
epiviz.plugins.charts.MyTrack.prototype.draw = function(range, data, slide, zoom) {
    epiviz.ui.charts.Track.prototype.draw.call(this, range, data, slide, zoom);

    // If data is defined, then the base class sets this._lastData to data.
    // If it isn't, then we'll use the data from the last draw call.
    // Same with this._lastRange and range.
    data = this._lastData;
    range = this._lastRange;

    // If data is not defined, there is nothing to draw
    if (!data || !range) { return []; }

    // Using D3, compute a function that maps base-pair locations to chart pixel coordinates
    var xScale = d3.scale.linear()
      .domain([range.start(), range.end()])
      .range([0, this.width() - this.margins().left() - this.margins().right()]);

    // Compute the minimum maximum values of values to be plotted on the Y axis:
    // Iterate throught all measurements that the chart is supposed to draw and find
    // default minimum and maximum values.
    var minY, maxY;
    this.measurements().foreach(function(m) {
      if (minY == undefined || m.minValue() < minY) {
        minY = m.minValue();
      }
      if (maxY == undefined || m.maxValue() > maxY) {
        maxY = m.maxValue();
      }
    });

    // Now create a function that maps measurement values to chart pixel coordinates
    var yScale = d3.scale.linear()
      .domain([minY, maxY])
      .range([this.height() - this.margins().top() - this.margins().bottom(), 0]);

    // Draw x and y axes
    var xTicks = 10, yTicks = 5;
    this._clearAxes();
    this._drawAxes(xScale, yScale, xTicks, yTicks);

    // Create an array of items to be drawn
    /** @type {Array.<epiviz.ui.charts.UiObject>} */
    var items = [];
    this.measurements().foreach(function(m, i) {
      /** @type {epiviz.datatypes.GenomicDataMeasurementWrapper} */
      var dataSeries = data.get(m);

      for (var j = 0; j < dataSeries.size(); ++j) {
        /** @type {epiviz.datatypes.GenomicDataMeasurementWrapper.ValueItem} */
        var valueItem = dataSeries.get(j);

        // Check that the current item overlaps the requested draw range; if not, skip it.
        if (valueItem.rowItem.start() > range.end() || valueItem.rowItem.end() < range.start()) { continue; }

        items.push(new epiviz.ui.charts.UiObject(
          sprintf('item-%s-%s', i, valueItem.globalIndex), // an id that uniquely identifies this object
          valueItem.rowItem.start(), // start location of current item
          valueItem.rowItem.end(), // end location of current item
          [valueItem.value], // the Y value for the current object
          i, // series index
          [[valueItem]],
          [m], // measurement
          'item' // css class
        ));
      }
    });

    var itemsGroup = this._svg.select('.items');
    if (itemsGroup.empty()) {
      itemsGroup = this._svg.append('g').attr('class', 'items');
    }
    itemsGroup.attr('transform', 'translate(' + this.margins().left() + ', ' + this.margins().top() + ')');

    var selection = itemsGroup.selectAll('.item')
      .data(items, function(uiObj) { return uiObj.id; });

    var self = this;
    selection
      .enter()
      .append('rect')
      .attr('class', function(uiObj) { return uiObj.cssClasses; })
      .style('fill', function(uiObj) { return self.colors().get(uiObj.seriesIndex); })
      .attr('x', function(uiObj) { return xScale(uiObj.start); })
      .attr('width', function(uiObj) { return xScale(uiObj.end + 1) - xScale(uiObj.start); })
      .attr('y', function(uiObj) { return yScale(minY) - yScale(uiObj.values[0]); })
      .attr('height', function(uiObj) { return yScale(uiObj.values[0]); })
      .style('opacity', '0')
      .on('mouseout', function () { self._unhover.notify(); })
      .on('mouseover', function (uiObj) { self._hover.notify(uiObj); })
      .on('click', function(uiObj) {
        self._deselect.notify();
        self._select.notify(uiObj);
        d3.event.stopPropagation();
      });

    selection
      .transition()
      .duration(500)
      .attr('x', function(uiObj) { return xScale(uiObj.start); })
      .attr('width', function(uiObj) { return xScale(uiObj.end + 1) - xScale(uiObj.start); })
      .attr('y', function(uiObj) { return yScale(minY) - yScale(uiObj.values[0]); })
      .attr('height', function(uiObj) { return yScale(uiObj.values[0]); })
      .style('opacity', '0.2');

    selection
      .exit()
      .transition()
      .duration(500)
      .style('opacity', '0')
      .remove();

    return items;
};
- Create a class used as factory, derived from
epiviz.ui.charts.TrackTypeorepiviz.ui.charts.PlotType
Example
goog.provide('epiviz.plugins.charts.MyTrackType');

/**
 * @param {epiviz.Config} config
 * @extends {epiviz.ui.charts.TrackType}
 * @constructor
 */
epiviz.plugins.charts.MyTrackType = function(config) {
    // Call superclass constructor
    epiviz.ui.charts.TrackType.call(this, config);
};

/*
 * Copy methods from upper class
 */
epiviz.plugins.charts.MyTrackType.prototype = epiviz.utils.mapCopy(epiviz.ui.charts.TrackType.prototype);
epiviz.plugins.charts.MyTrackType.constructor = epiviz.plugins.charts.MyTrackType;

/**
 * @param {string} id
 * @param {jQuery} container The div where the chart will be drawn
 * @param {epiviz.ui.charts.ChartProperties} properties
 * @returns {epiviz.plugins.charts.MyTrack}
 */
epiviz.plugins.charts.MyTrackType.prototype.createNew = function(id, container, properties) {
    return new epiviz.plugins.charts.MyTrack(id, container, properties);
};

/**
 * @returns {string}
 */
epiviz.plugins.charts.MyTrackType.prototype.typeName = function() { return 'epiviz.plugins.charts.MyTrack'; };

/**
 * @returns {string}
 */
epiviz.plugins.charts.MyTrackType.prototype.chartName = function() { return 'My Track'; };

/**
 * @returns {string}
 */
epiviz.plugins.charts.MyTrackType.prototype.chartHtmlAttributeName = function() { return 'mytrack'; };

/**
 * @returns {epiviz.measurements.Measurement.Type}
 */
epiviz.plugins.charts.MyTrackType.prototype.chartContentType = function() { return epiviz.measurements.Measurement.Type.FEATURE; };
- In the settings file, add an entry in the
chartTypesproperty corresponding to the track type.
Example
...
chartTypes: [
    ...,
    'epiviz.plugins.charts.MyTrackType'
],
...
Alternatively, create a script to override the default {{ site.epiviz }} settings and add the new chart type:
epiviz.EpiViz.SETTINGS.chartTypes.push('epiviz.plugins.charts.MyTrackType');
- If using Epiviz on a remote server, plug in your scripts and settings file and start using them!
Example
my-track.js,my-track-type.jsandmy-settings-overrides.js: http://gist.github.com/9cff81ce56ba153f0b72
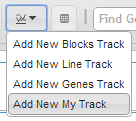
In the Track Menu, notice the new type of visualization, called My Track

In Epiviz, data can be retrieved simultaneously from any number of servers (like the UMD PHP server, or the Epivizr
Websocket server). The proxies between the servers and the Epiviz UI are called Data providers. Currently, Epiviz has two predefined types of data providers: epiviz.data.WebServerDataProvider and epiviz.data.WebSocketDataProvider.
However, through Epiviz plugin mechanism, users can add new data providers to interface other sources of data.
- Create a new class and inherit
epiviz.data.DataProvider.
Example
goog.provide('epiviz.plugins.data.MyDataProvider');

/**
 * @constructor
 * @extends {epiviz.data.DataProvider}
 */
epiviz.plugins.data.MyDataProvider = function () {
    epiviz.data.DataProvider.call(this);
};

/**
 * Copy methods from upper class
 */
epiviz.plugins.data.MyDataProvider.prototype = epiviz.utils.mapCopy(epiviz.data.DataProvider.prototype);
epiviz.plugins.data.MyDataProvider.constructor = epiviz.plugins.data.MyDataProvider;

epiviz.plugins.data.MyDataProvider.DEFAULT_ID = 'myprovider';

/**
 * @param {epiviz.data.Request} request
 * @param {function(epiviz.data.Response)} callback
 * @override
 */
epiviz.plugins.data.MyDataProvider.prototype.getData = function (request, callback) {
};
- Override and implement the
getData(request, callback)method.
The Request/Response API has the following format:
{
    requestId: number,
    type: string,
    data: Object.<string, *>
}
-
requestIdis a unique numeric id identifying the request; responses are paired with requests by using the samerequestIdvalue. -
typecan be either'request'or'response', depending on the message type. -
datais a map of key-value pairs of request/response arguments.For requests,
dataalways has an'action'key, identifying the request type. The possible values for'action'are defined in the Epiviz API in the enum typeepiviz.data.Request.Action. The other request keys and values vary depending on the action.Actions are grouped in two categories - Server Actions (requests from the UI to the Data Provider) and UI Actions (requests from the Data Provider to the UI).
Server Actions
Action Args Response format Description 'getRows''seqName': string,'start': number,'end': number,'metadata': string[], a list of metadata columns in the data source table'datasource': string, the name of the data source table{ globalStartIndex: ?number, useOffset: boolean, values: { id: number[], start: number[], end: number[], metadata: Object.<string, string[]> }} Requests range data for a given data source. 'getValues''seqName': string,'start': number,'end': number,'datasource': string, the name of the data source table,'measurement': string, the name of the column in the table where values reside{ globalStartIndex: ?number, values: number[]} Requests the values in a particular column of a data source table. 'getMeasurements'{ id: string[], name: string[], type: string[], datasourceId: string[], datasourceGroup: string[], defaultChartType: string[], annotation: Array.<Object.<string, string>>, minValue: number[], maxValue: number[], metadata: Array.<string[]>} Requests all the measurements available to serve by the data provider. 'getSeqInfos'Array.<Array> an array of arrays of three elements: sequence name, minimum and maximum base pair boundaries. For example: [[‘chr1’, 1, 248956422], [‘myChr’, 1, 1000000000]] Requests the sequence information - name and boundaries available to serve by the data provider. 'search''q': string, a text to filter results by'maxResults': number, the maximum number of results to returnoptional Requests gene and Affymetrix probe information for data that contains the given filter string. 'saveWorkspace''id': string,'name': string,'content': Object.<string, *>optional Sends information about the active workspace to the data provider, in order to be saved. 'deleteWorkspace''id': string,optional Requests the deletion of the workspace with the given id. 'getWorkspaces''q': string,'ws': stringoptional Requests all the workspace for the current user whose names match the given filter. UI Actions
Action Args Response format Description 'addMeasurements''removeMeasurements''addSeqInfos''removeSeqNames''addChart''removeChart''clearDatasourceGroupCache''flushCache''navigate'
Example implementation
goog.provide('epiviz.plugins.data.MyDataProvider');

/**
 * @constructor
 * @extends {epiviz.data.DataProvider}
 */
epiviz.plugins.data.MyDataProvider = function () {
    epiviz.data.DataProvider.call(this);

    this._mockMeasurement = new epiviz.measurements.Measurement(
      'my_feature_column', // The column in the data source table that contains the values for this feature measurement
      'My Feature Measurement', // A name not containing any special characters (only alphanumeric and underscores)
      epiviz.measurements.Measurement.Type.FEATURE,
      'my_datasource', // Data source: the table/data frame containing the data
      'my_datasourcegroup', // An identifier for use to group with other measurements from different data providers
                            // that have the same seqName, start and end values
      this.id(), // Data provider
      null, // Formula: always null for measurements coming directly from the data provider
      'Line Track', // Default chart type filter
      null, // Annotation
      -5, // Min Value
      25, // Max Value
      ['my_metadata'] // Metadata columns
    );
};

/**
 * Copy methods from upper class
 */
epiviz.plugins.data.MyDataProvider.prototype = epiviz.utils.mapCopy(epiviz.data.DataProvider.prototype);
epiviz.plugins.data.MyDataProvider.constructor = epiviz.plugins.data.MyDataProvider;

epiviz.plugins.data.MyDataProvider.DEFAULT_ID = 'myprovider';

/**
 * @param {epiviz.data.Request} request
 * @param {function(epiviz.data.Response)} callback
 * @override
 */
epiviz.plugins.data.MyDataProvider.prototype.getData = function (request, callback) {
    var requestId = request.id();
    var action = request.get('action');
    var seqName = request.get('seqName');
    var start = request.get('start');
    var end = request.get('end');
    var datasource = request.get('datasource');

    // Return a genomic range of 100 base pairs every 1000 base pairs
    var step = 1000, width = 100;
    var globalStartIndex, firstStart, firstEnd;
    if (action == epiviz.data.Request.Action.GET_ROWS || action == epiviz.data.Request.Action.GET_VALUES) {
      globalStartIndex = Math.floor((start - 1) / step) + 1;
      firstStart = globalStartIndex * step + 1;
      firstEnd = firstStart + width;

      if (firstEnd < start) {
        firstStart += step;
        firstEnd += step;
      }
    }

    var globalIndex, s;
    switch (action) {
      case epiviz.data.Request.Action.GET_ROWS:
        if (firstStart >= end) {
          // Nothing to return
          callback(epiviz.data.Response.fromRawObject({
            data: { values: { id: [], start: [], end:[], strand: [], metadata:{my_metadata:[]} }, globalStartIndex: null, useOffset: false },
            requestId: requestId
          }));
          return;
        }

        var ids = [], starts = [], ends = [], strands = '*', myMetadata = [];
        for (globalIndex = globalStartIndex, s = firstStart; s < end; ++globalIndex, s += step) {
          ids.push(globalIndex);
          starts.push(s);
          ends.push(s + width);
          myMetadata.push(epiviz.utils.generatePseudoGUID(5)); // Random string
        }

        callback(epiviz.data.Response.fromRawObject({
          data: {
            values: { id: ids, start: starts, end: ends, strand: strands, metadata:{ my_metadata: myMetadata } },
            globalStartIndex: globalStartIndex,
            useOffset: false
          },
          requestId: requestId
        }));
        return;

      case epiviz.data.Request.Action.GET_VALUES:
        if (firstStart >= end) {
          // Nothing to return
          callback(epiviz.data.Response.fromRawObject({
            data: { values: [], globalStartIndex: null },
            requestId: requestId
          }));
          return;
        }

        var values = [];
        for (globalIndex = globalStartIndex, s = firstStart; s < end; ++globalIndex, s += step) {
          var v = Math.random()
            * (this._mockMeasurement.maxValue() - this._mockMeasurement.minValue())
            +  this._mockMeasurement.minValue();
          values.push(v);
        }

        callback(epiviz.data.Response.fromRawObject({
          data: {
            values: values,
            globalStartIndex: globalStartIndex
          },
          requestId: requestId
        }));

        return;

      case epiviz.data.Request.Action.GET_MEASUREMENTS:
        callback(epiviz.data.Response.fromRawObject({
          requestId: request.id(),
          data: {
            id: [this._mockMeasurement.id()],
            name: [this._mockMeasurement.name()],
            type: [this._mockMeasurement.type()],
            datasourceId: [this._mockMeasurement.datasourceId()],
            datasourceGroup: [this._mockMeasurement.datasourceGroup()],
            defaultChartType: [this._mockMeasurement.defaultChartType()],
            annotation: [this._mockMeasurement.annotation()],
            minValue: [this._mockMeasurement.minValue()],
            maxValue: [this._mockMeasurement.maxValue()],
            metadata: [this._mockMeasurement.metadata()]
          }
        }));
        return;

      case epiviz.data.Request.Action.GET_SEQINFOS:
        callback(epiviz.data.Response.fromRawObject({
          requestId: request.id(),
          data: [['chr1', 1, 248956422], ['myChr', 1, 1000000000]]
        }));
        return;

      default:
        epiviz.data.DataProvider.prototype.getData.call(this, request, callback);
        break;
    }
};
- Declare the data provider in your settings file, in the
dataProvidersproperty.
Example
dataProviders: [
    ...,
    'epiviz.plugins.data.MyDataProvider'
],
Alternatively, create a script to override the default Epiviz settings and add the new data provider:
epiviz.EpiViz.SETTINGS.dataProviders.push('epiviz.plugins.data.MyDataProvider');
- If using Epiviz on a remote server, plug in your scripts and settings file and start using them!
Example
my-data-provider.jsandmy-data-provider-settings-overrides.js: http://gist.github.com/63dce2a92d80f57637c6
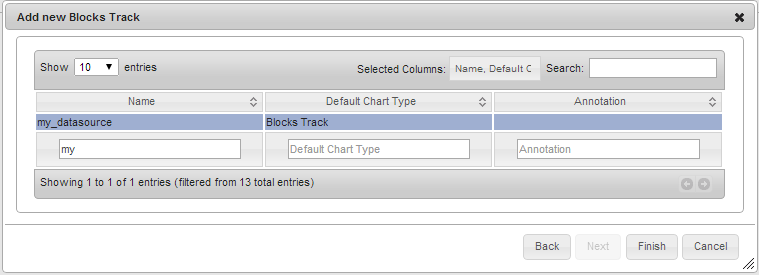
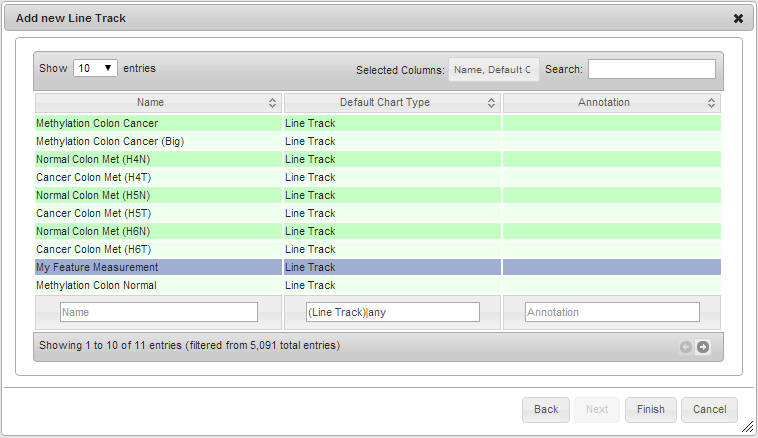
In the measurement selection dialogs, notice the new data source, my_datasource and the new measurement, My Measurement
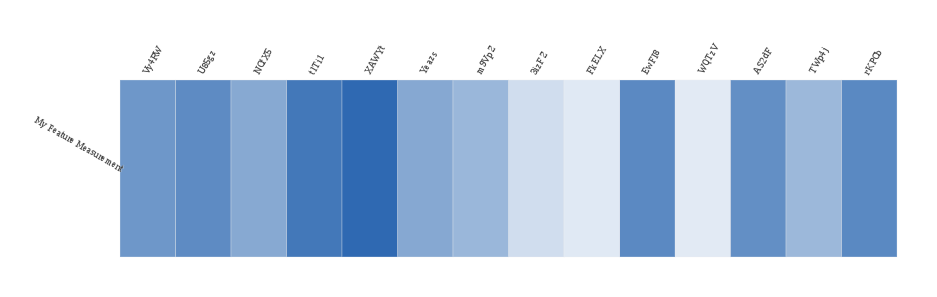
A heatmap displaying data provided by My DataProvider
A line track displaying data provided by My DataProvider

A blocks track displaying data provided by My DataProvider
