Metaviz Quick Overview
Metaviz is a tool for interactive visualization and exploration of metagenomic sequencing data. It provides a novel navigation tool for exploring hierarchical feature data that is coupled with multiple data visualizations including heatmaps, stacked bar charts, and scatter plots. Metaviz supports a flexible plugin framework so users can add new d3 visualizations. This post introduces the most compelling user interface features of Metaviz. An in-depth visual analysis using Metaviz can be found here.
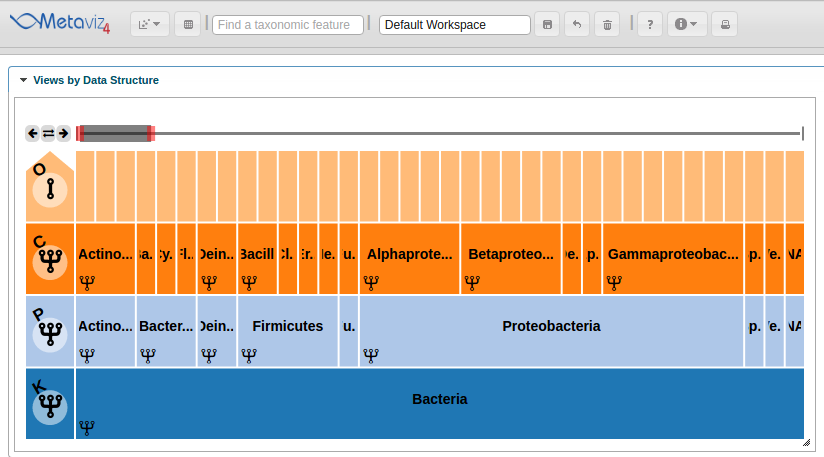
Novel Navigation Utility for Exploring Taxonomic Hierarchies
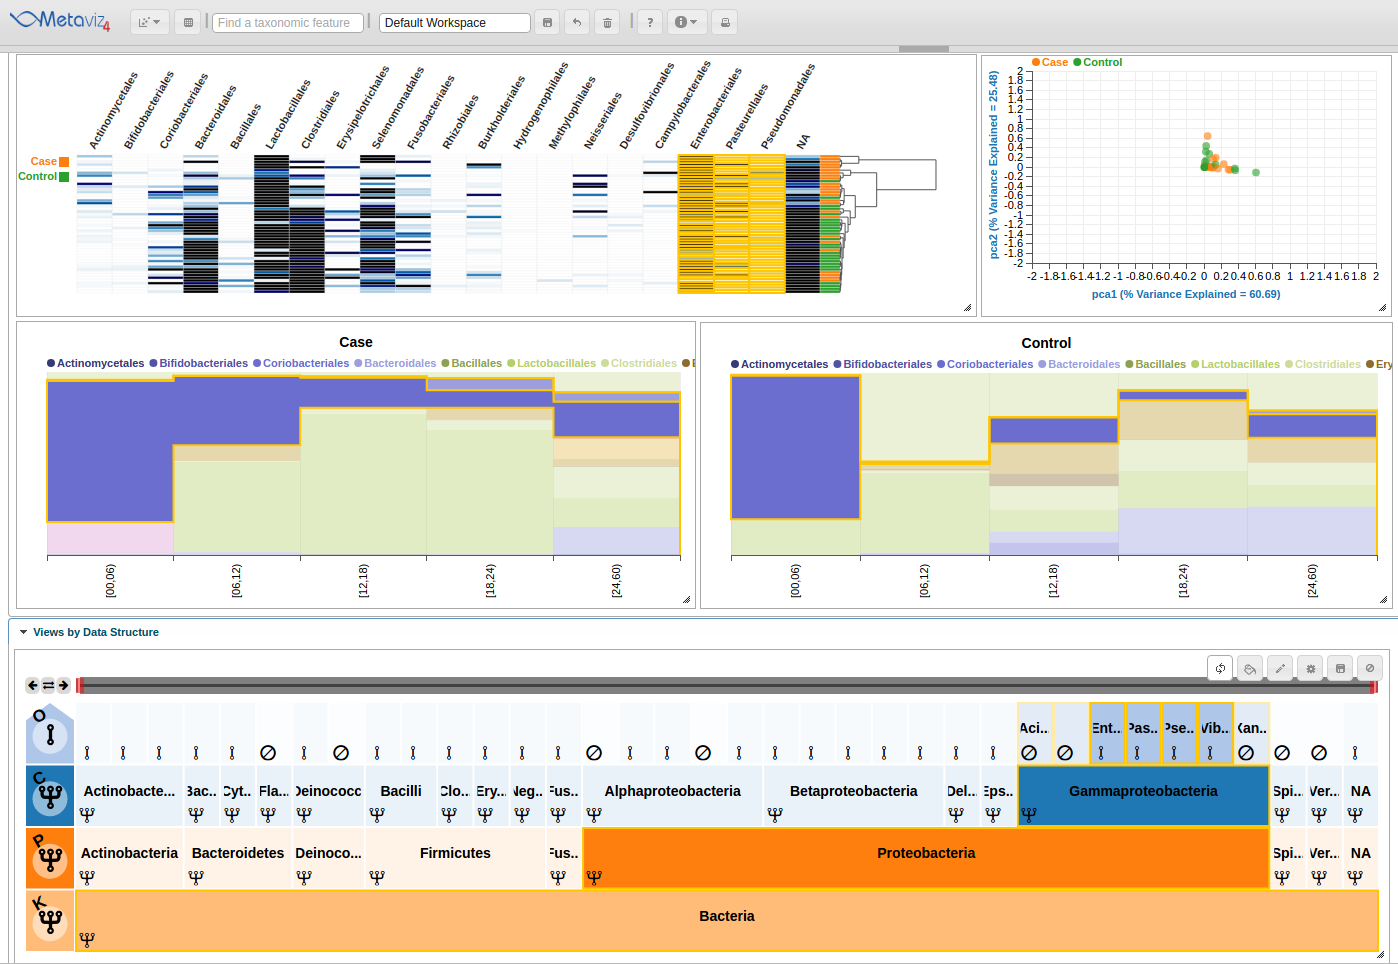
Effectively navigating the hierarchical space of features for metagenomic data is challenging. Metaviz is designed specifically to address this. The Metaviz workspace displayed below includes a ‘FacetZoom’ object that shows a limited section of the taxonomic hierarchy at one time. A ‘FacetZoom’ object can be used to explore the observed features in the dataset and aggregate counts to specific nodes or levels in the taxonomic hierarchy. We will introduce ‘FacetZoom’ functionality as needed throughout this workflow. A ‘FacetZoom’ object controls the views of data visualizations we will add in the next sections.
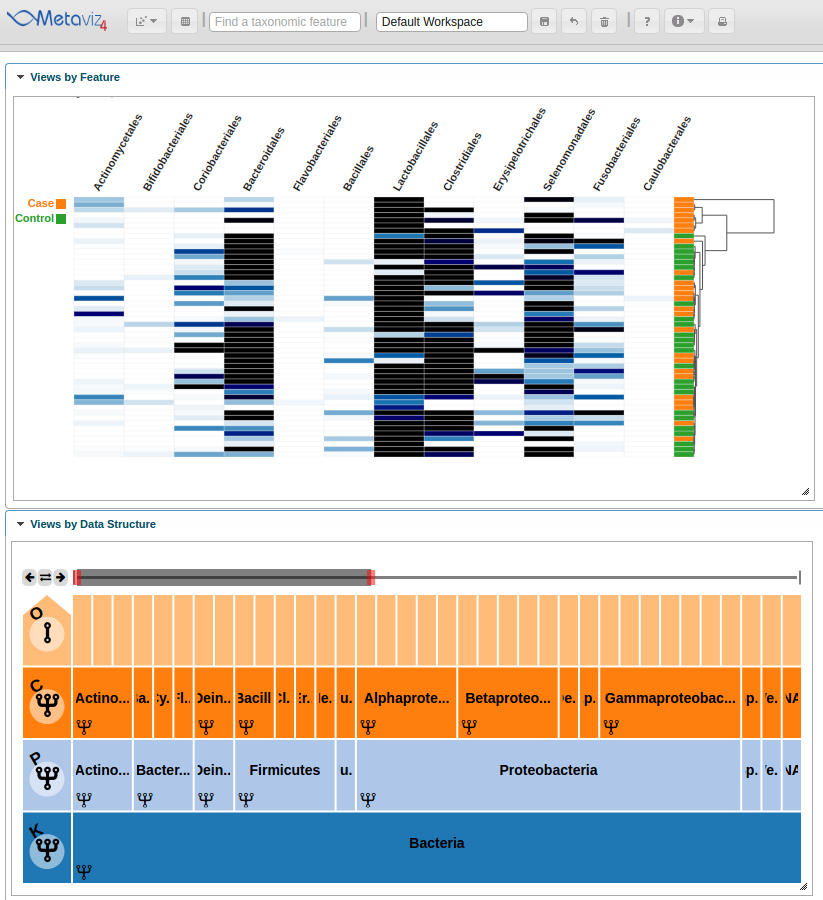
Heatmap Linked to Taxonomic Hierarchy
The next feature is linked charts that update on exploration with the ‘FacetZoom’ navigation object.
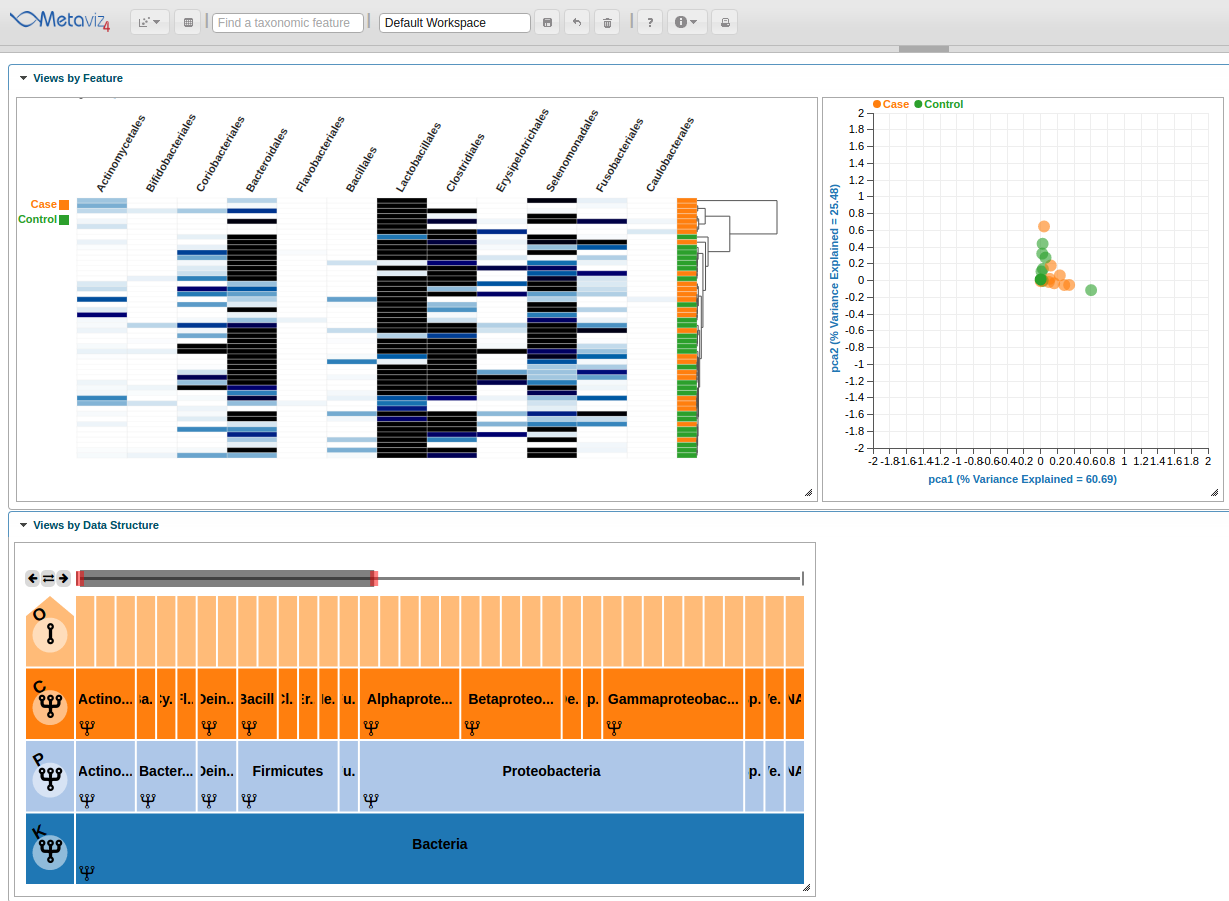
PCA Plots
Metaviz also provides PCA ordination plots with the samples colored by a selected attribute.
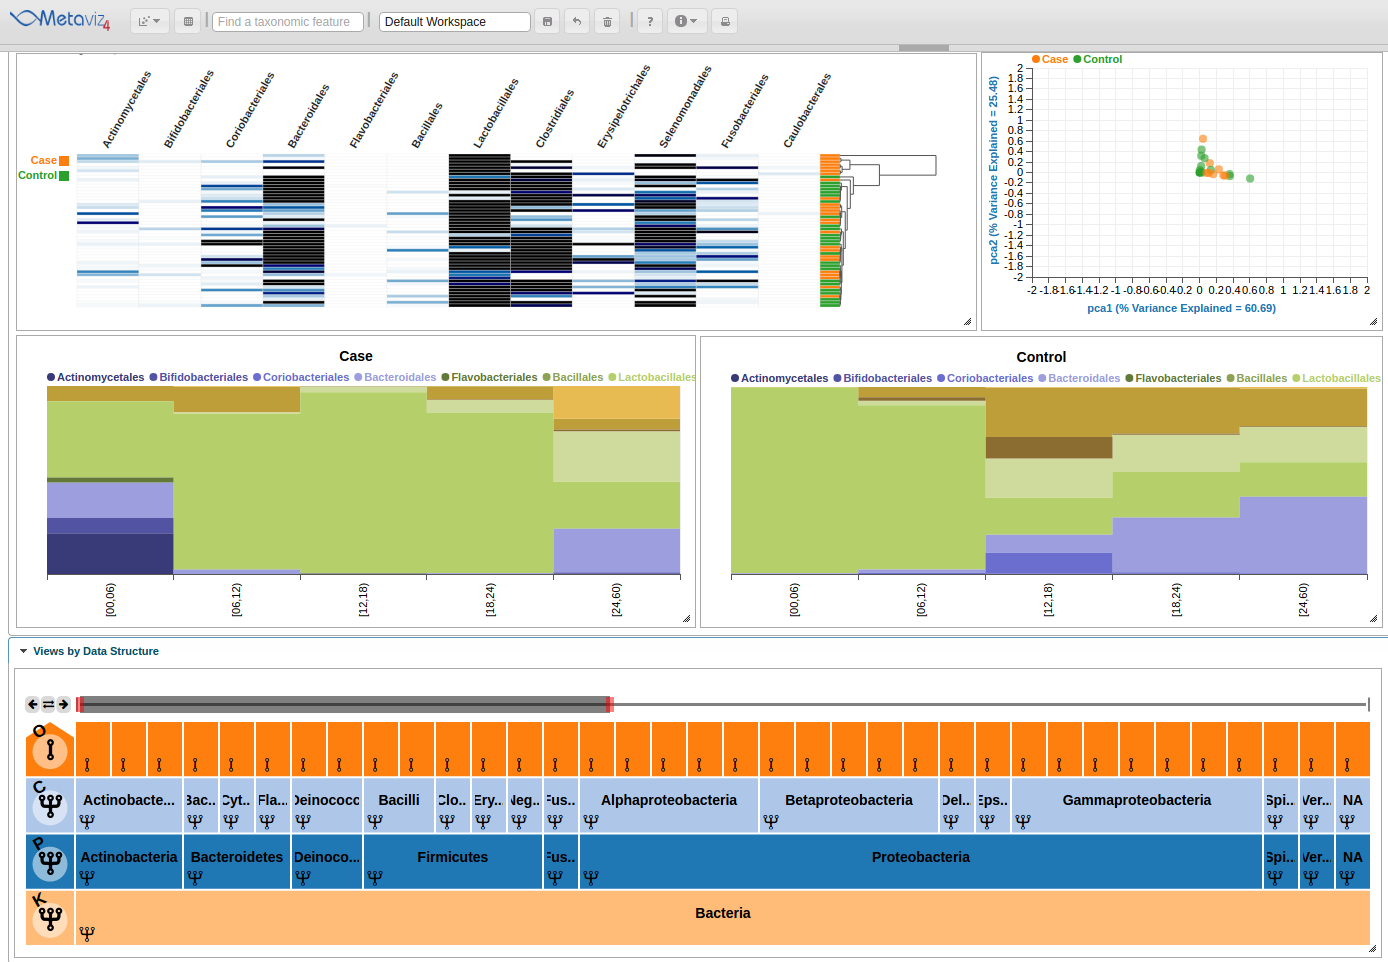
Stacked Bar Plots
With Metaviz, a user can create Stacked Bar Plots and group by or order by a given attribute. A user can also make separate charts for case and control samples for comparison.
Text Search
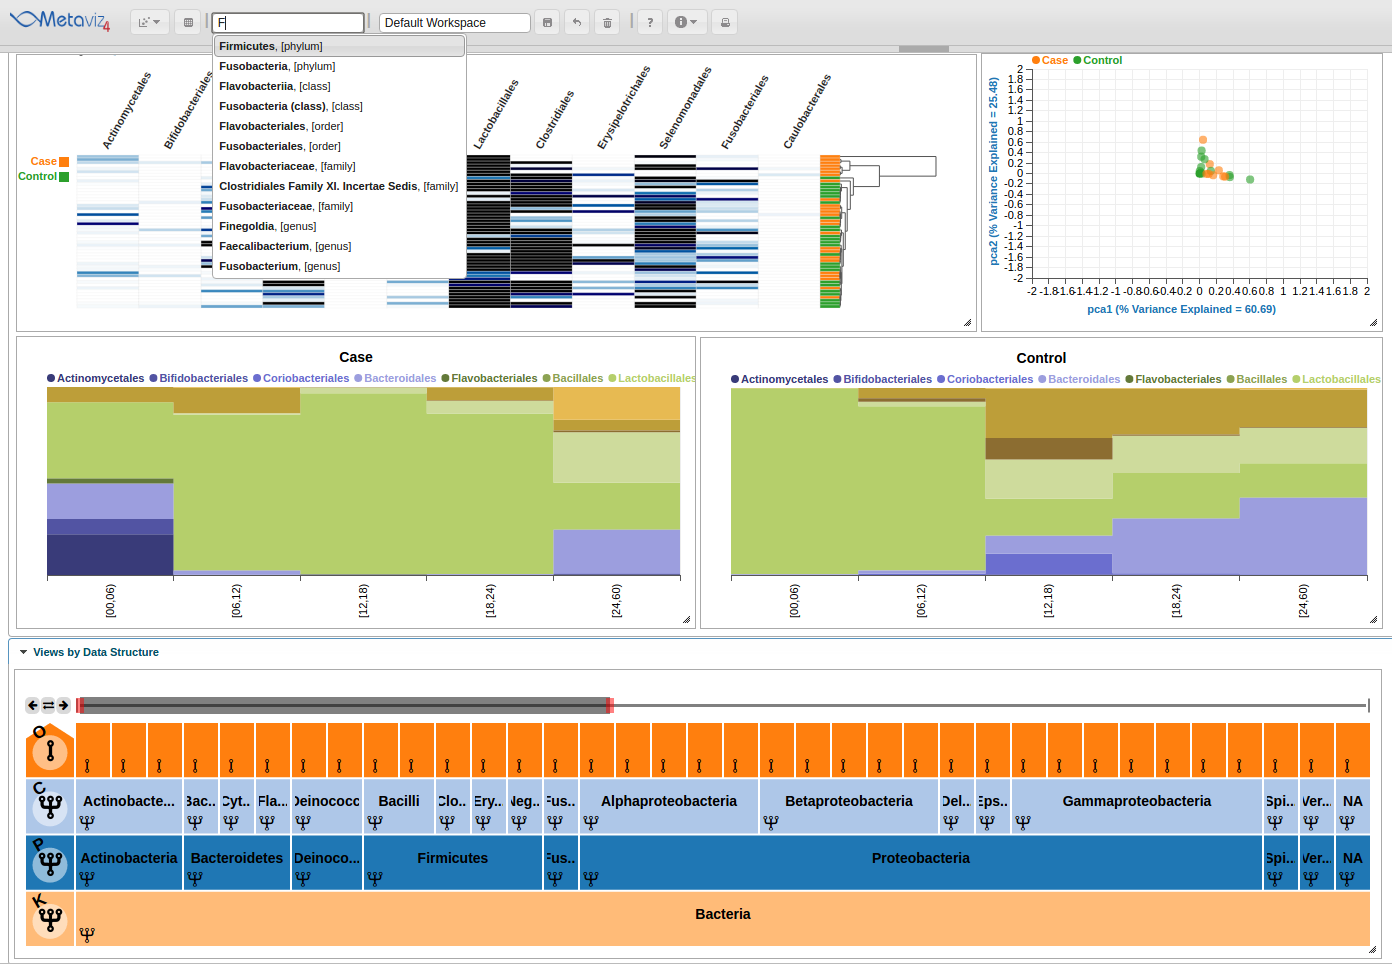
Complementary to the ‘FacetZoom’ object, Metaviz provides text-based search which can be used by typing in the text box in the menu bar ‘Text Based Search’ to search for specific taxonomic features.
Choose ‘Firmucutes’, ‘phylum’ from the drop down menu. This will move the navigation bar to encompass that item.
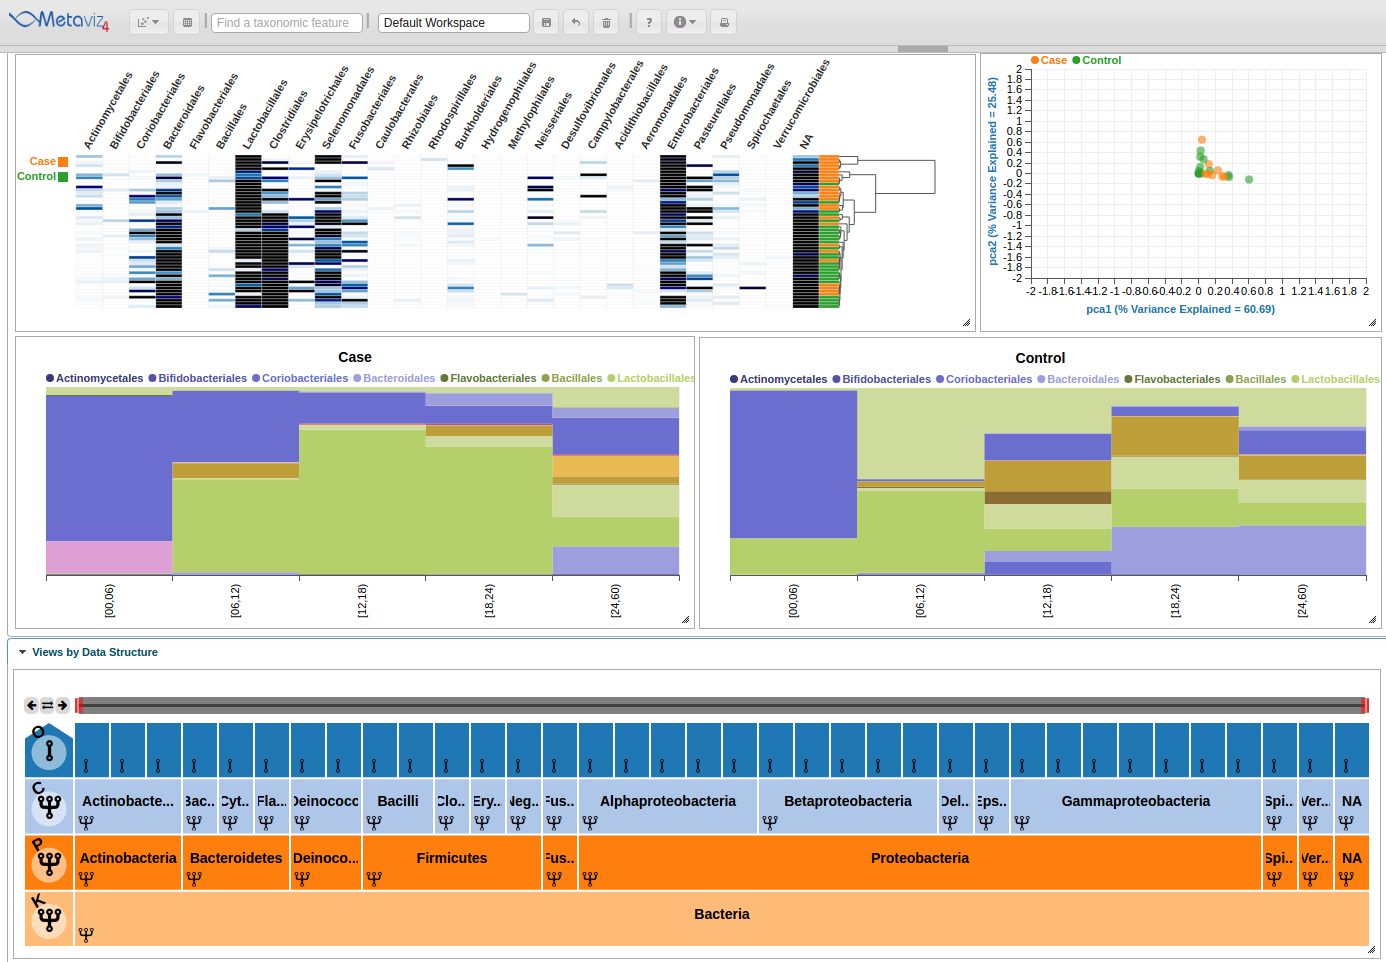
 Beyond text-based search, the navigation bar can be moved, expanded, and reduced by using either the controls in the left-hand corner of the FacetZoom object or by dragging the red ends of the navigation bar.
Aggregation at any set of nodes in hierarchy
Now we will navigate the FacetZoom object to see selections update the heatmap and stacked line plots.
You can interact with the FacetZoom object by clicking on any node. Clicking on a node at a lower level than the root of the hierarchy will render a new subtree. Each node can is in one of three states: (1) expanded, which means that the children of the node are shown in visualizations, (2) aggregated, which means that the counts for all children nodes are summed to that node, or (3) removed, which means that the node and all of its children are removed from visualizations.
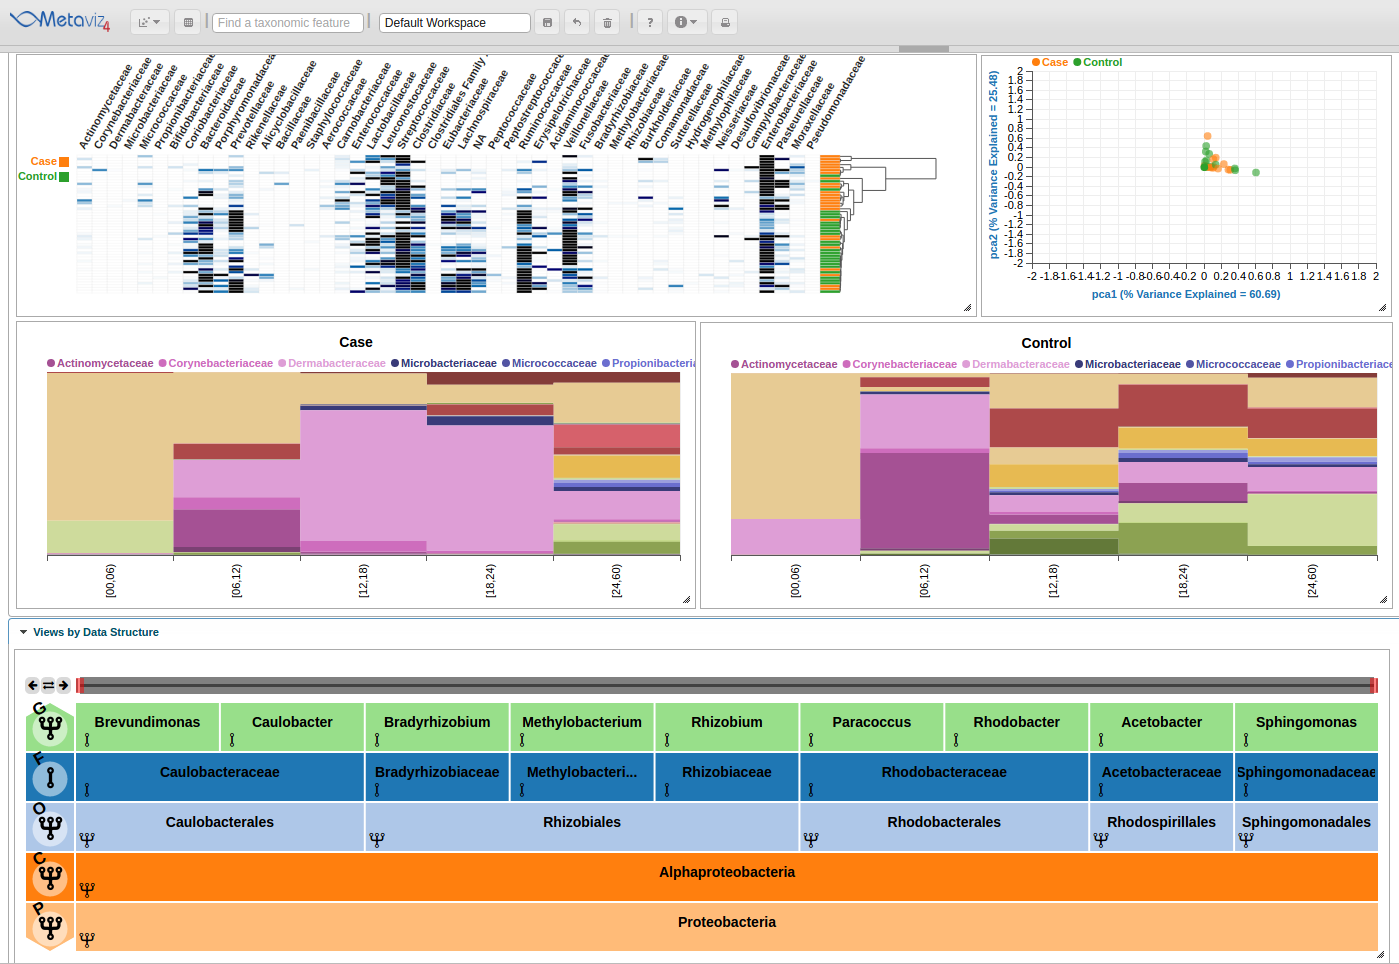
To show the states, we click through on the first node of the second row ‘Proteobacteria’ and then we also click directly on the node to show a new subtree and explore the feature hierarchy. To set aggregation for an entire level, adjust the row control to set the aggregation to another level. Click on the fourth item, with an ‘F’ standing for ‘Family’ and now all counts are summed to the Family level nodes across the samples in the charts.
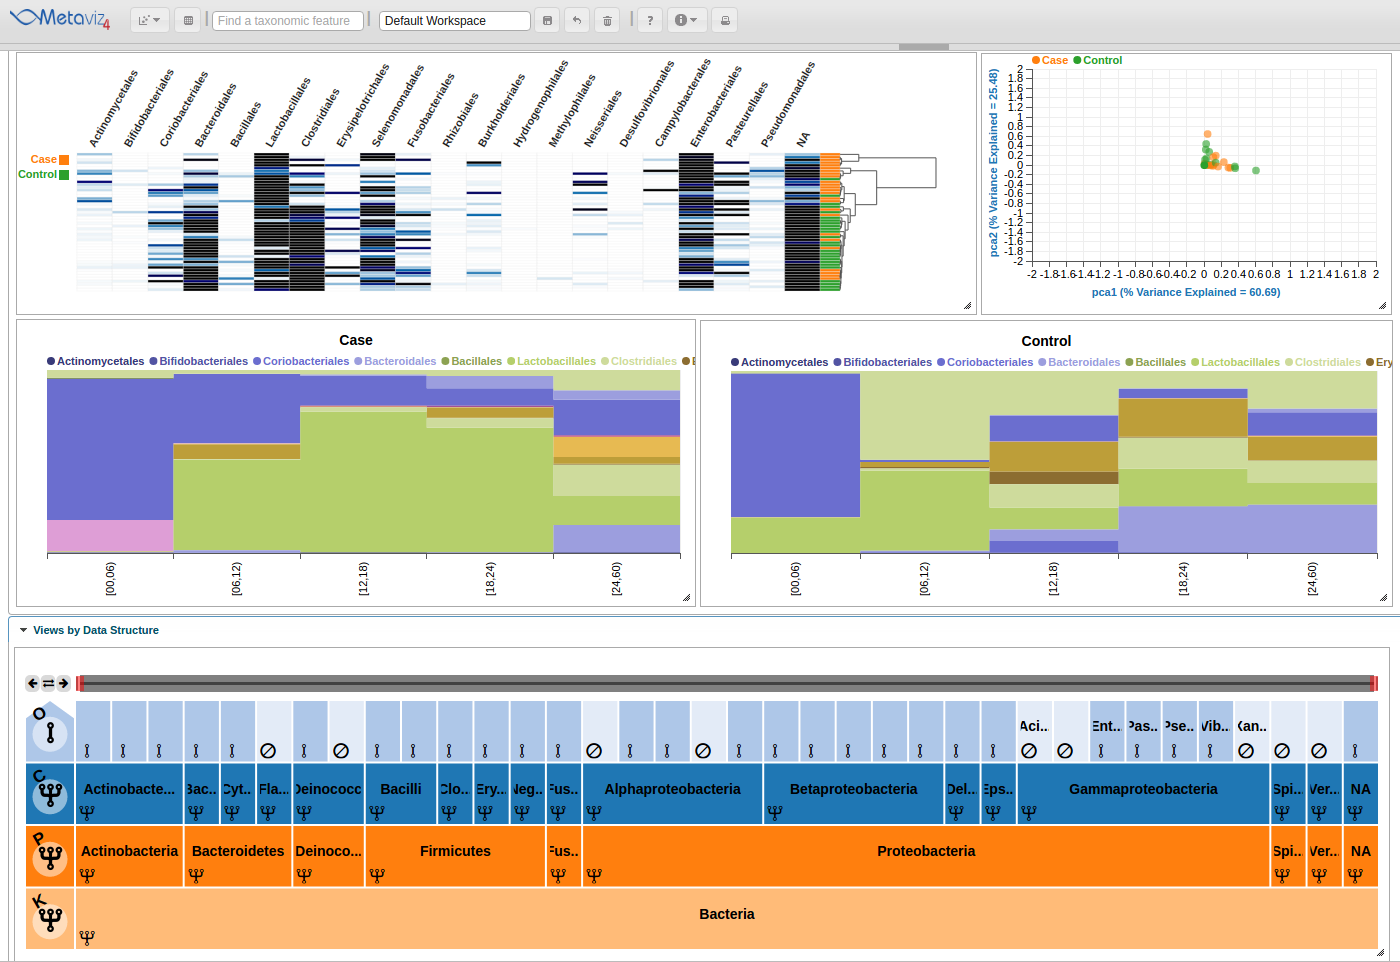
Next, we change the aggregation level back to Order and navigate to have ‘Bacteria’ as the root of the FacetZoom. We then set some nodes to ‘expanded’, ‘removed’, and ‘aggregated’. We made the following selections based on the appearance of the heatmap.
Finally, we see the highlight of the path in the hierarchy and across the heatmaps and stacked plots.
In upcoming posts we will include a more detailed example of the usage of Metaviz, including how to integrate with R/Bioconductor for statistical analysis of metagenomic datasets.