Hosting Data in Metaviz
Metaviz is a tool for interactive visualization and exploration of metagenomic sequencing data. It provides a novel navigation tool for exploring hierarchical feature data that is coupled with multiple data visualizations including heatmaps, stacked bar charts, and scatter plots. In this post we show how to load into a Metaviz backend database. We also talk about our plans to host a metagenomics data repository accessible at metaviz.cbcb.umd.edu.
Loading data using metavizR
metavizr is an R-package that can serve data from an R session to a Metaviz browser instance and load data into a persistent graph database. In this section we will load the mouseData available from the metagenomeSeq Bioconductor package. metavizr operates over a metagenomeSeq MRexperiment object to build a hierarchy tree data structure over the features and makes count data available at any level of the tree through aggregation.
We first load the metavizr and metagenomeSeq packages along with the data.
library(metagenomeSeq)
library(metavizr)
data(mouseData)
Now we use the mouseData MRexperiment object to create an EpivizMetagenomicsData object with metavizr.
feature_order <- c("superkingdom","phylum","class","order","family","genus","OTU")
obj <- metavizr:::EpivizMetagenomicsData$new(object = mouseData, feature_order = feature_order)
Next we call the ‘toNEO4jDb’ which will build a hierarchy tree using the metagenomeSeq object, add all features nodes to a graph database, then add all sample nodes to the database, add edges denoting hierarchy levels between all feature nodes, and add edges between leaf feature nodes and sample nodes to denote observed count values.
obj$toNEO4JDbHTTP(batch_url = "http://localhost:7474/db/data/batch", neo4juser = "user", neo4jpass = "pass", datasource = "mouseData")
Abundance matrix data format
For the abundance matrix, which is typically a biom file, we need each entry of the “rows” field to have the “metadata”” field contain a key “taxonomy” with the value as the taxonomic lineage for that feature. We also need a non-null value for the “metadata” key for each entry of the “columns” field which denotes the sample attributes. We provide format validation in the metavizr package with appropriate error messages for each criteria.
CBCB storage
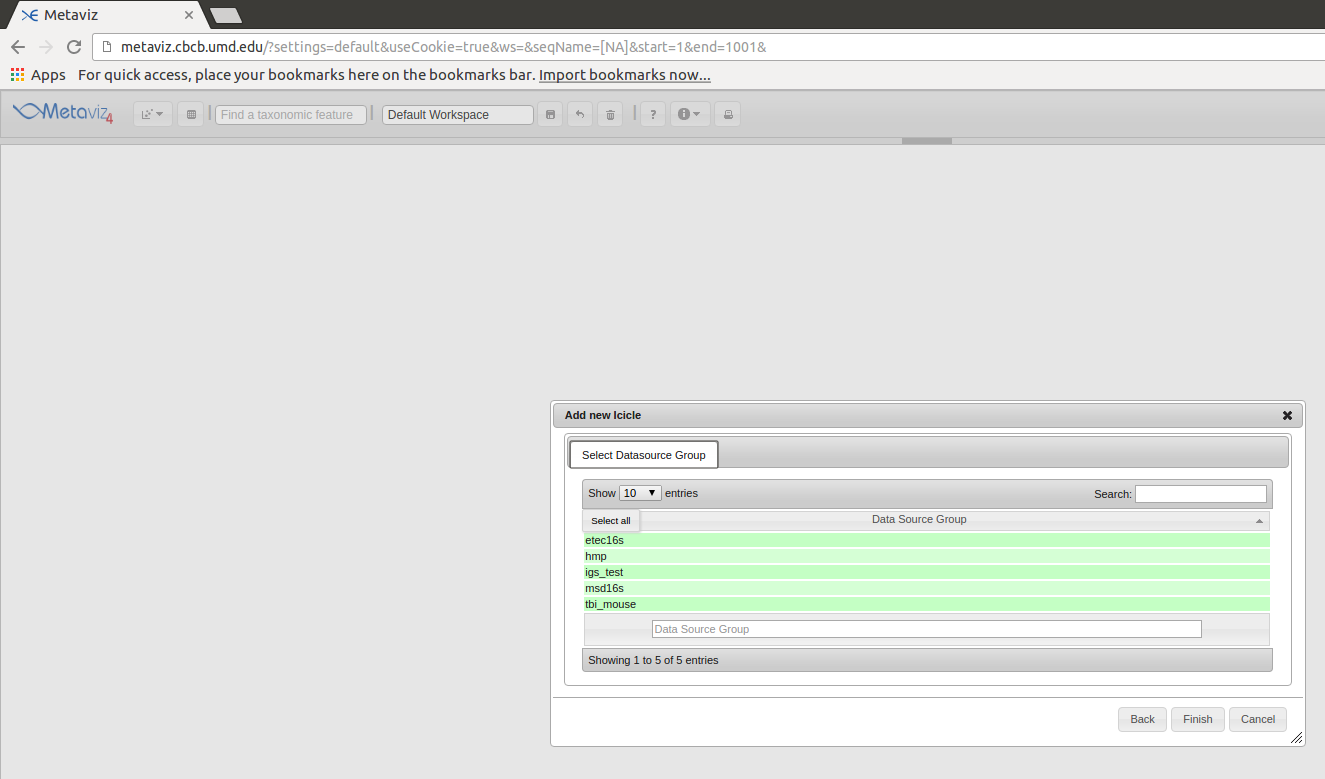
We can add datasets to our database and make them accessible through metaviz.cbcb.umd.edu. We currently store 5 datasets - 3 from published datasets and 2 from collaborators. The datasets are stored in one Neo4j instance with a top-level node that is the initial node we query of the disconnected graph for each dataset. These top-level nodes are what is rendered in the initial measurement browser pop-up when adding a chart to the Metaviz workspace.
Contact Us
For hosting a dataset, please email us at hcorrada@umiacs.umd.edu.
For any functionality requests, please post an issue in the appropriate repository at https://github.com/epiviz/.