Create a Diversity Plot with HMP2Data IBD Biopsy
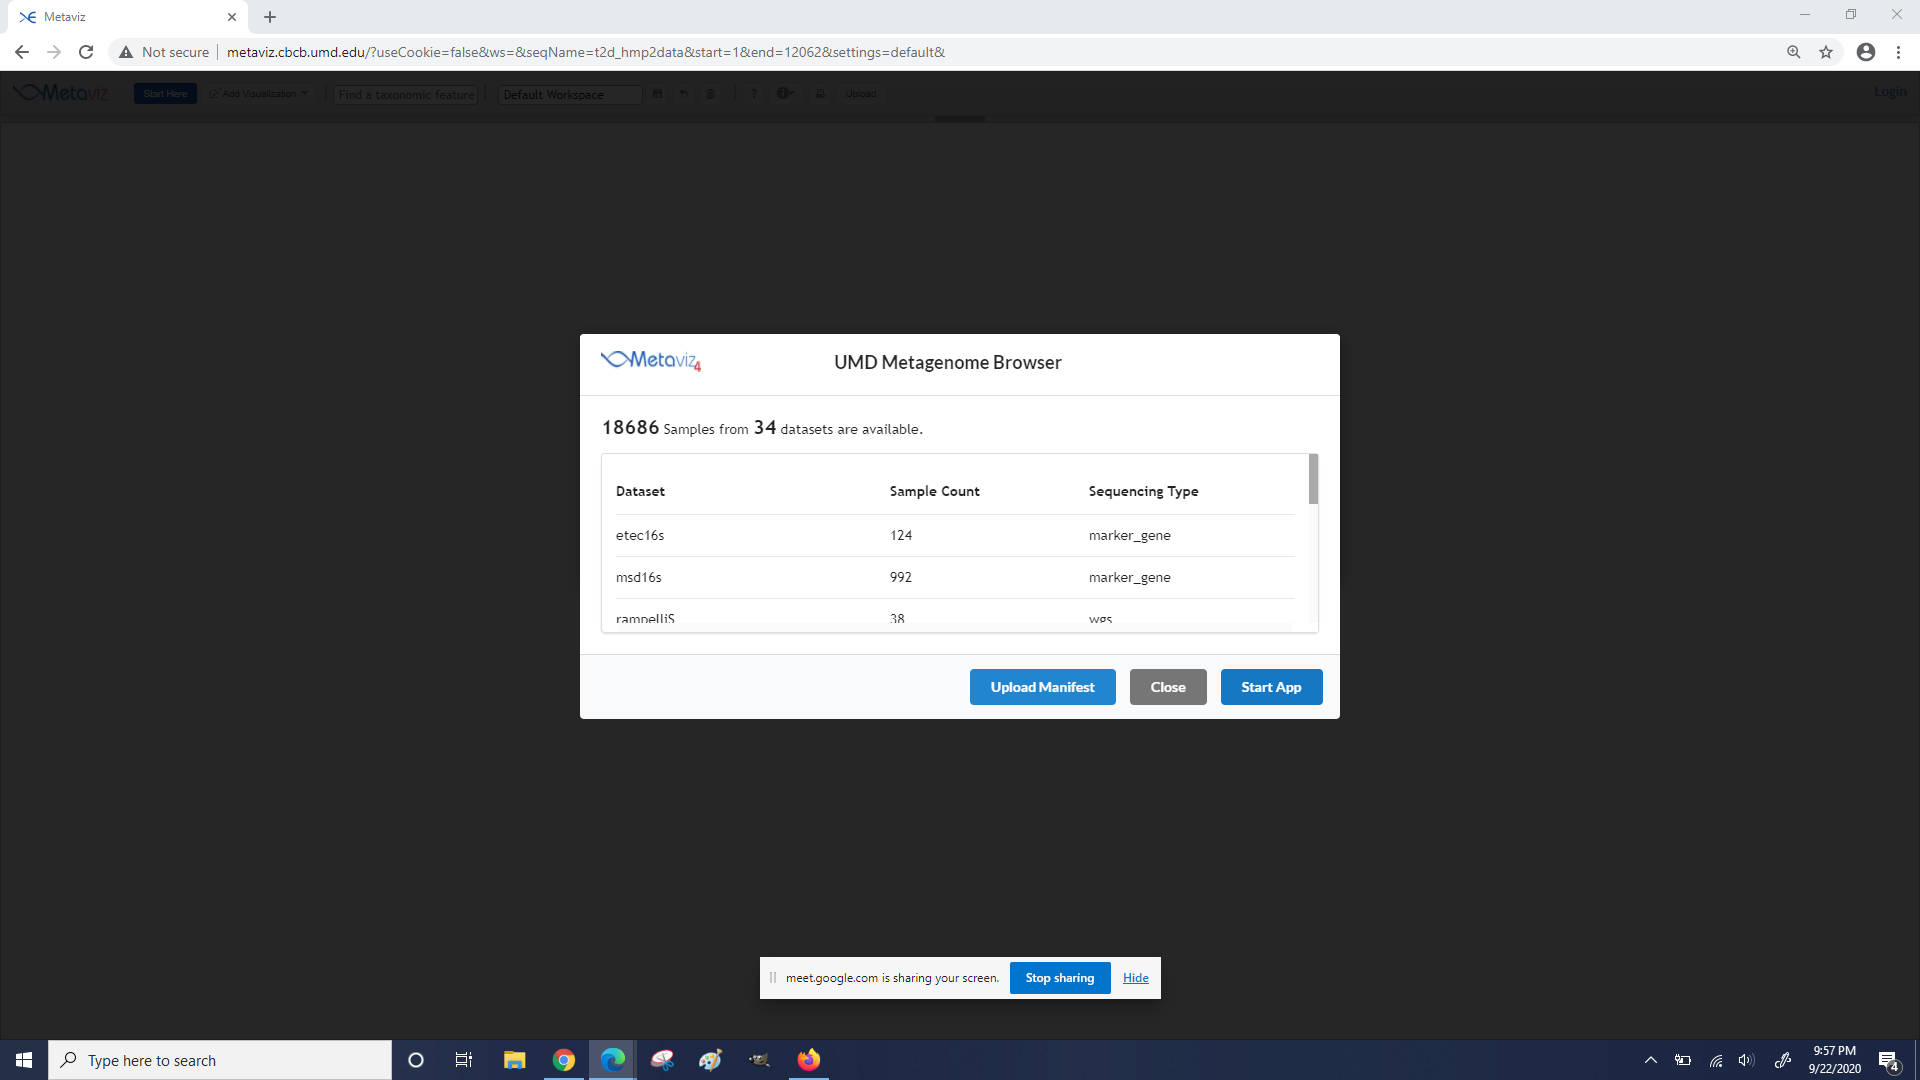
First on the Metaviz landing page click “Start App”
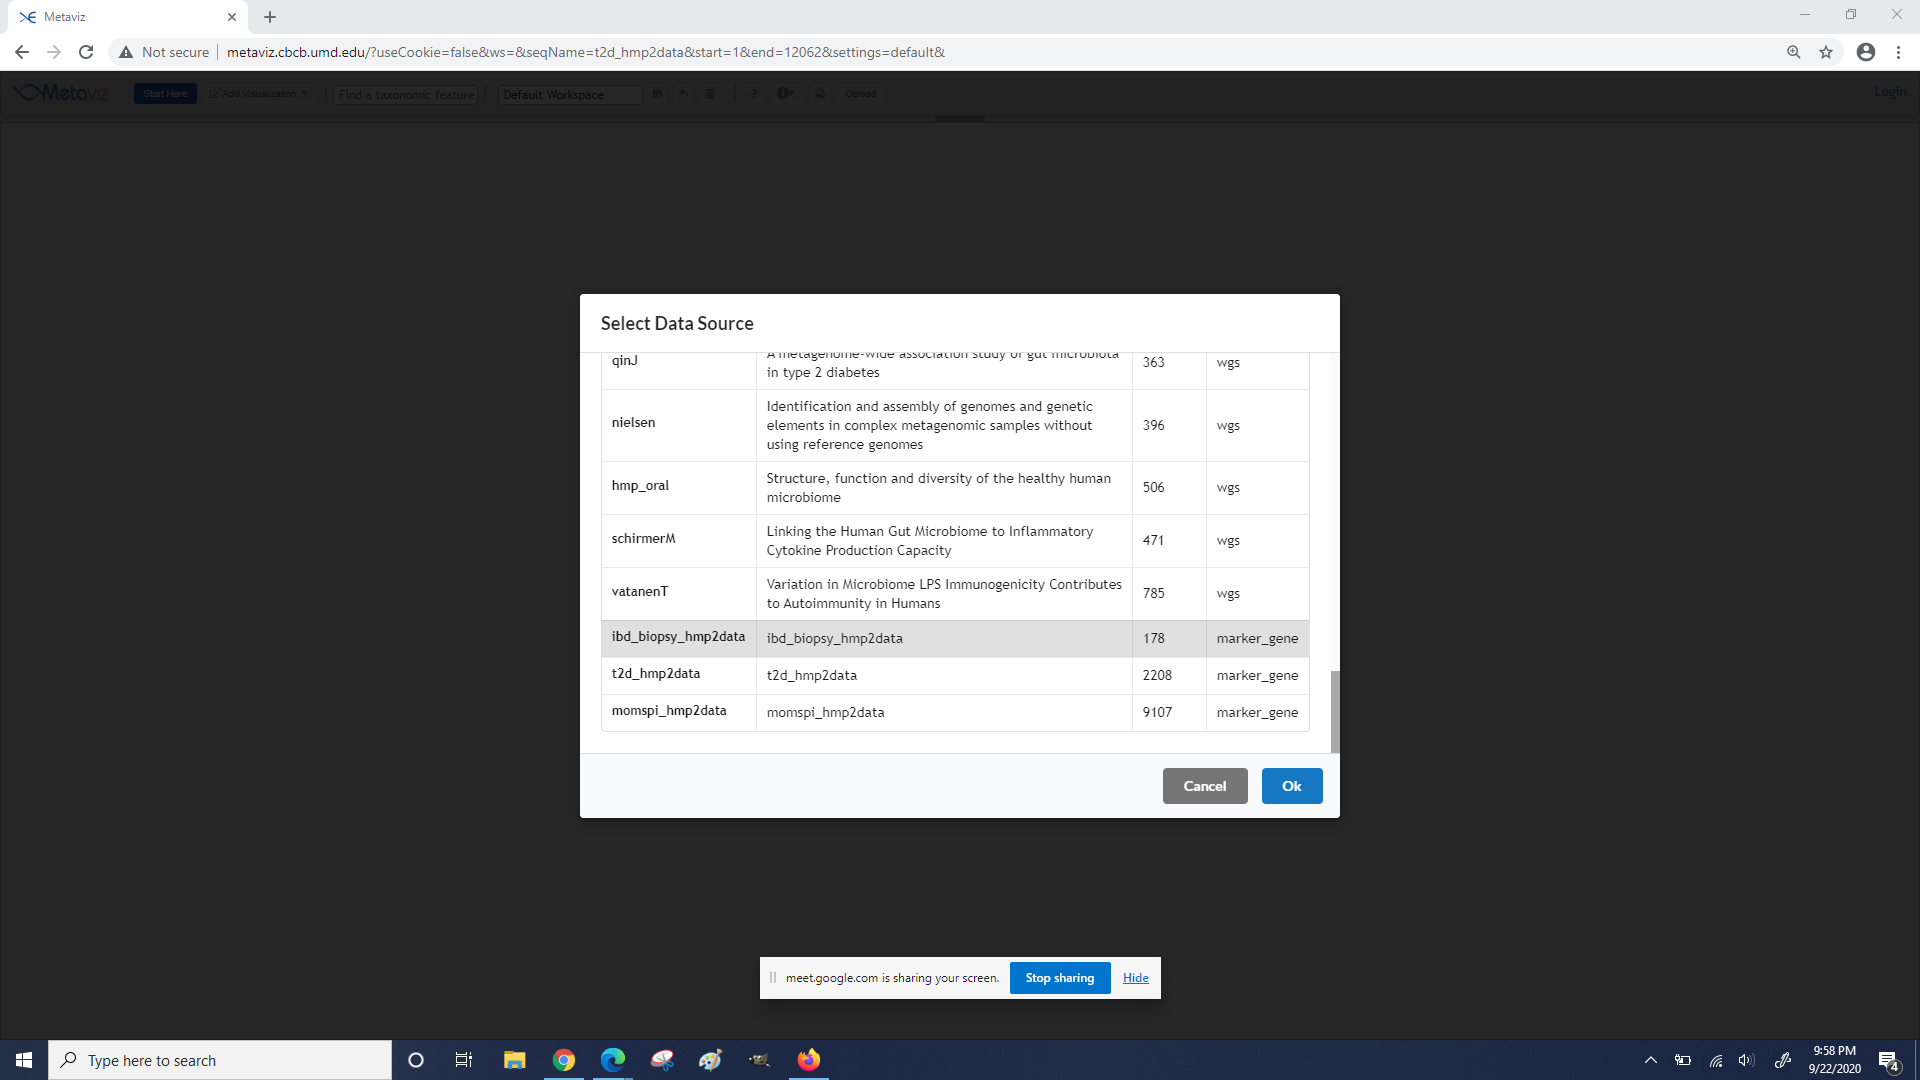
Next scroll to the bottom and select “ibd_biopsy_hmp2data”
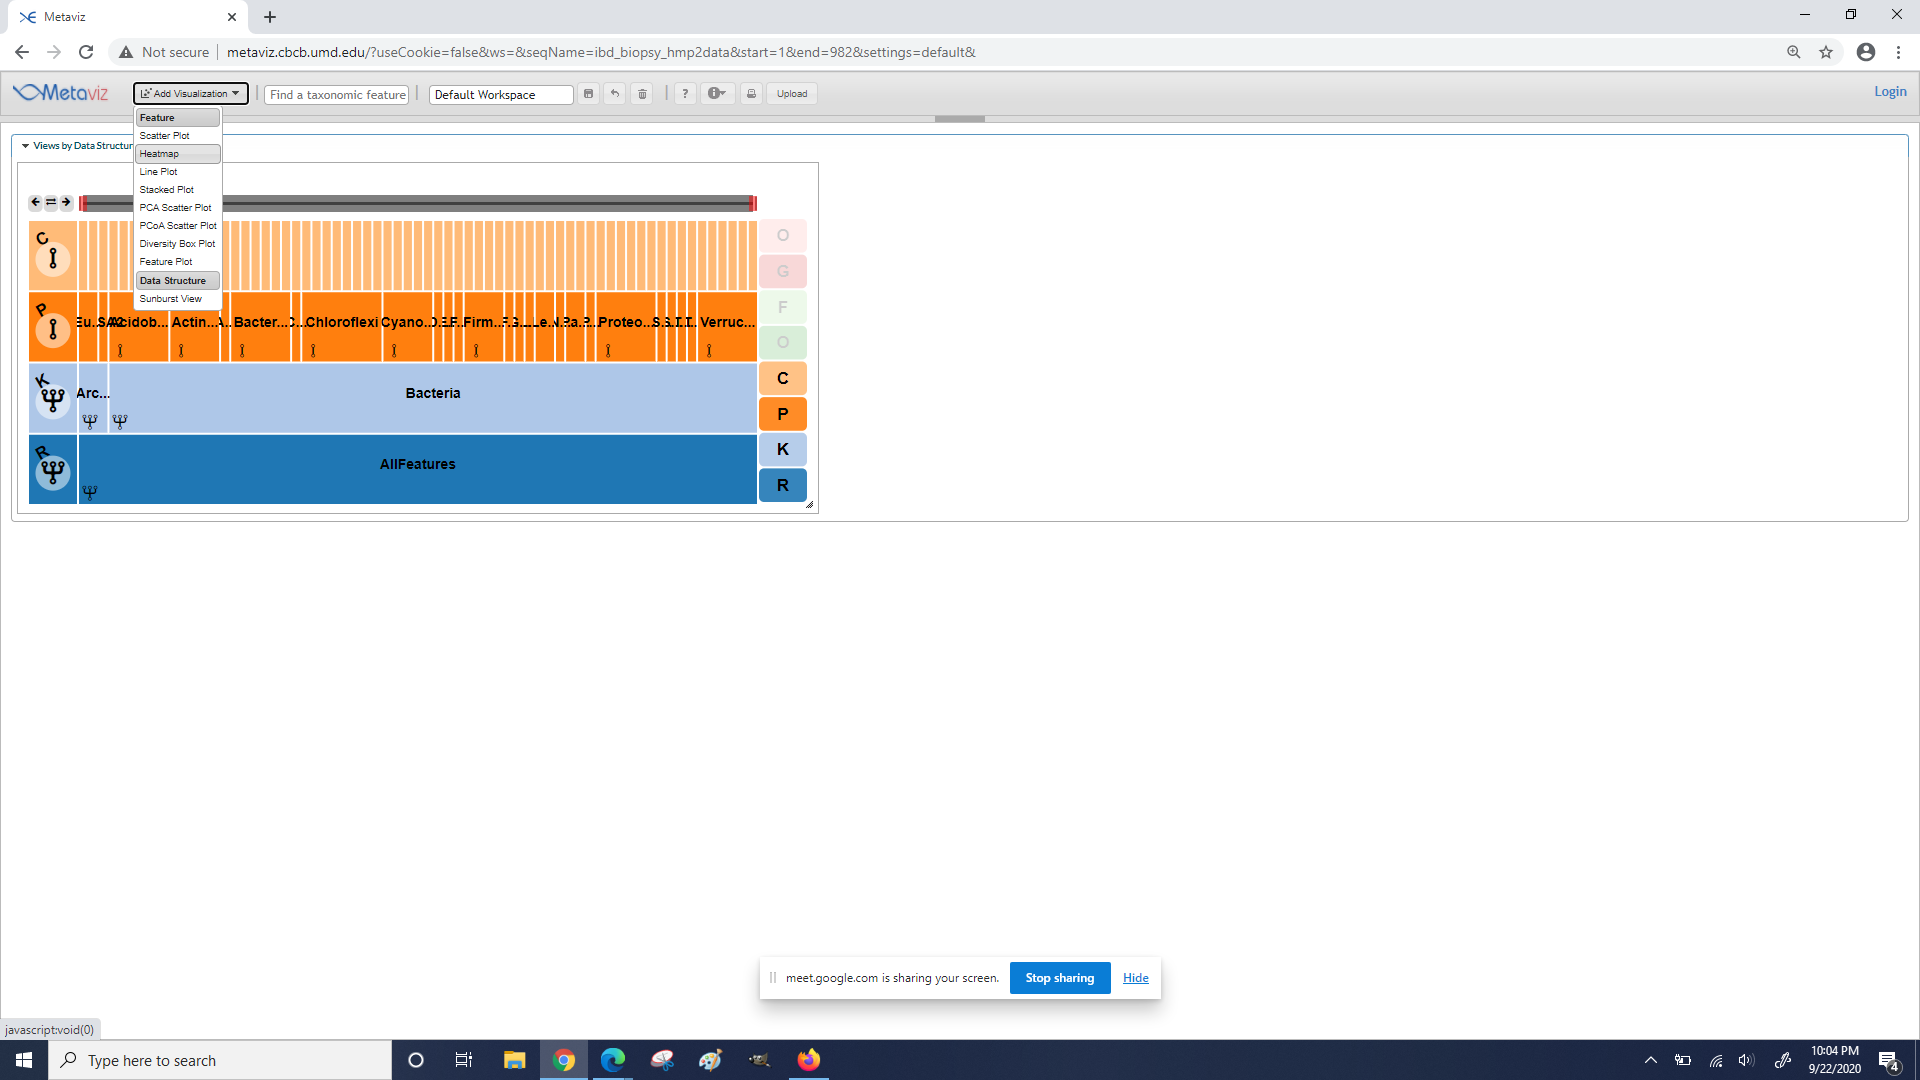
Choose “Add Visualization” and click “Heatmap”"
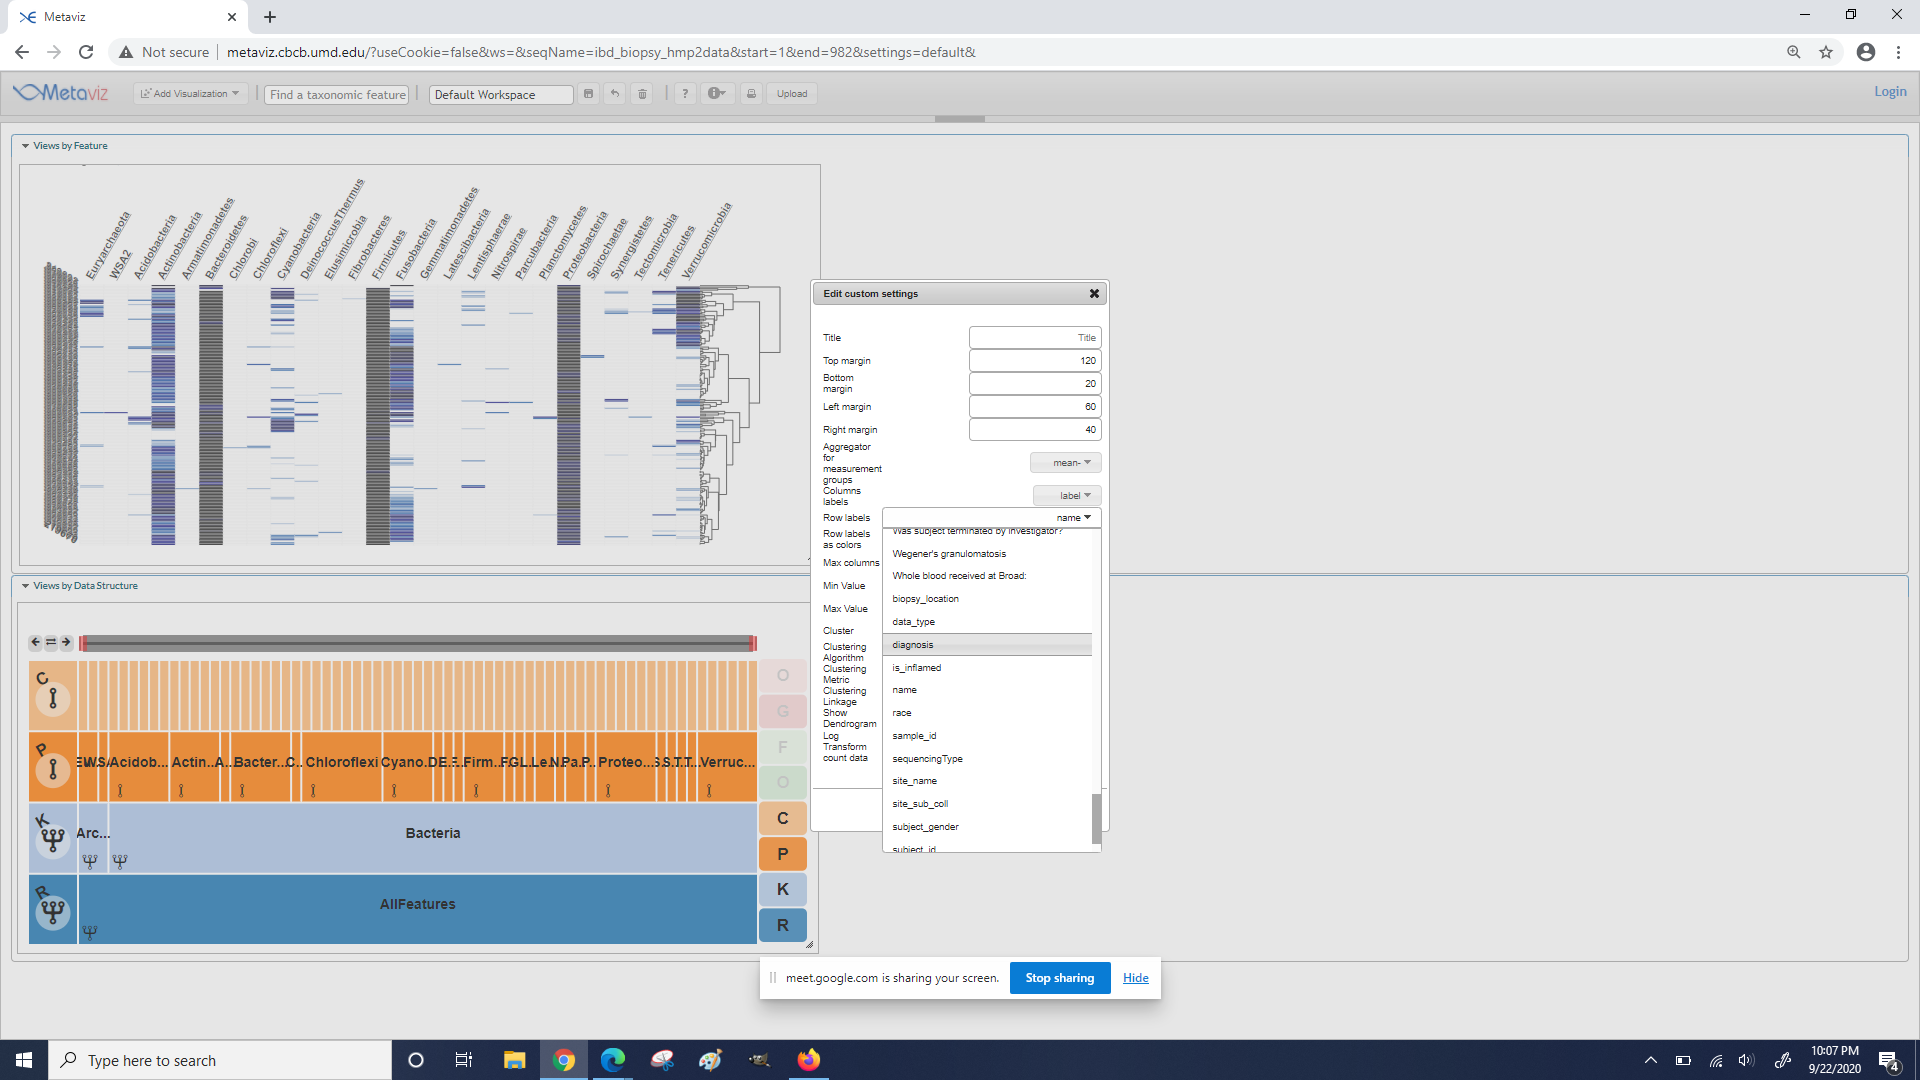
On the Heatmap click the Settings icon (middle) and in the Settings menu change “Plot Label” dropdown menu from “name” to “diagnosis” and toggle the button for “Row labels as color” to “On”
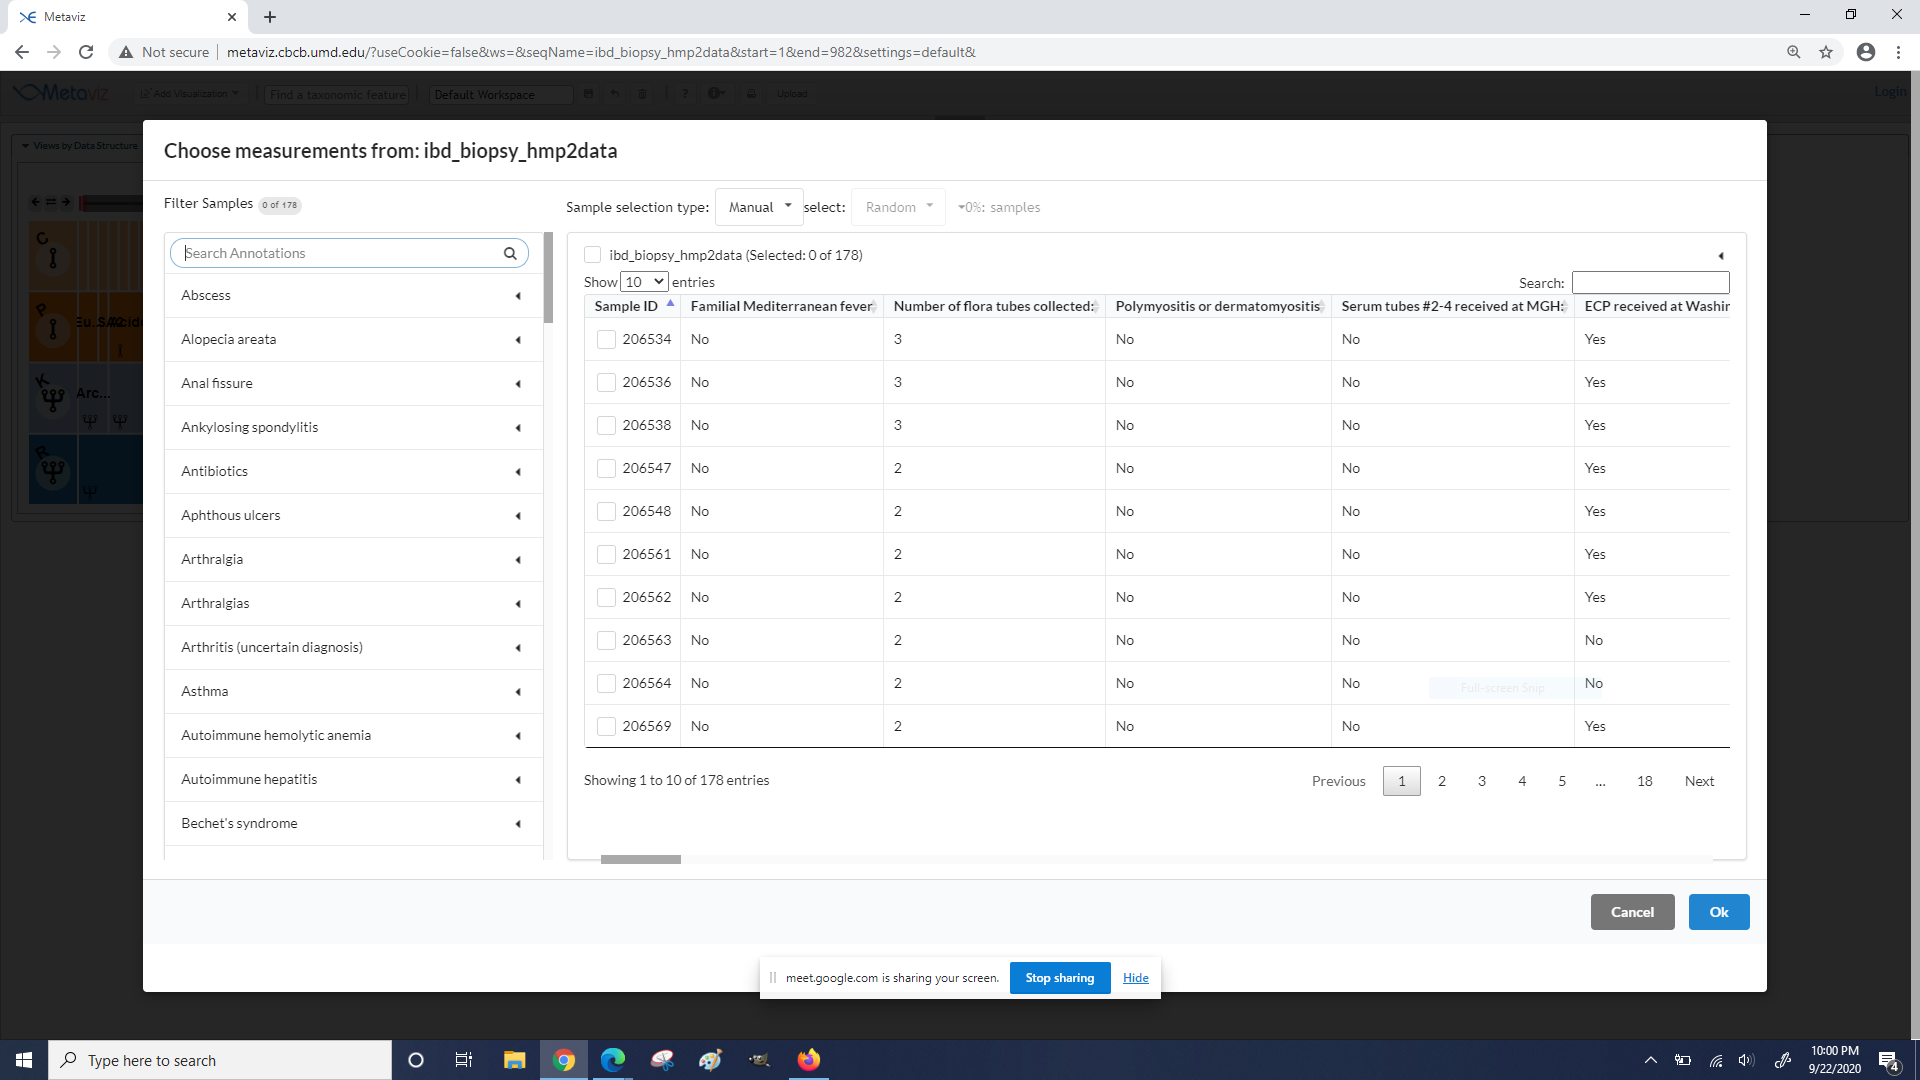
Select samples to visualize and click “Ok”
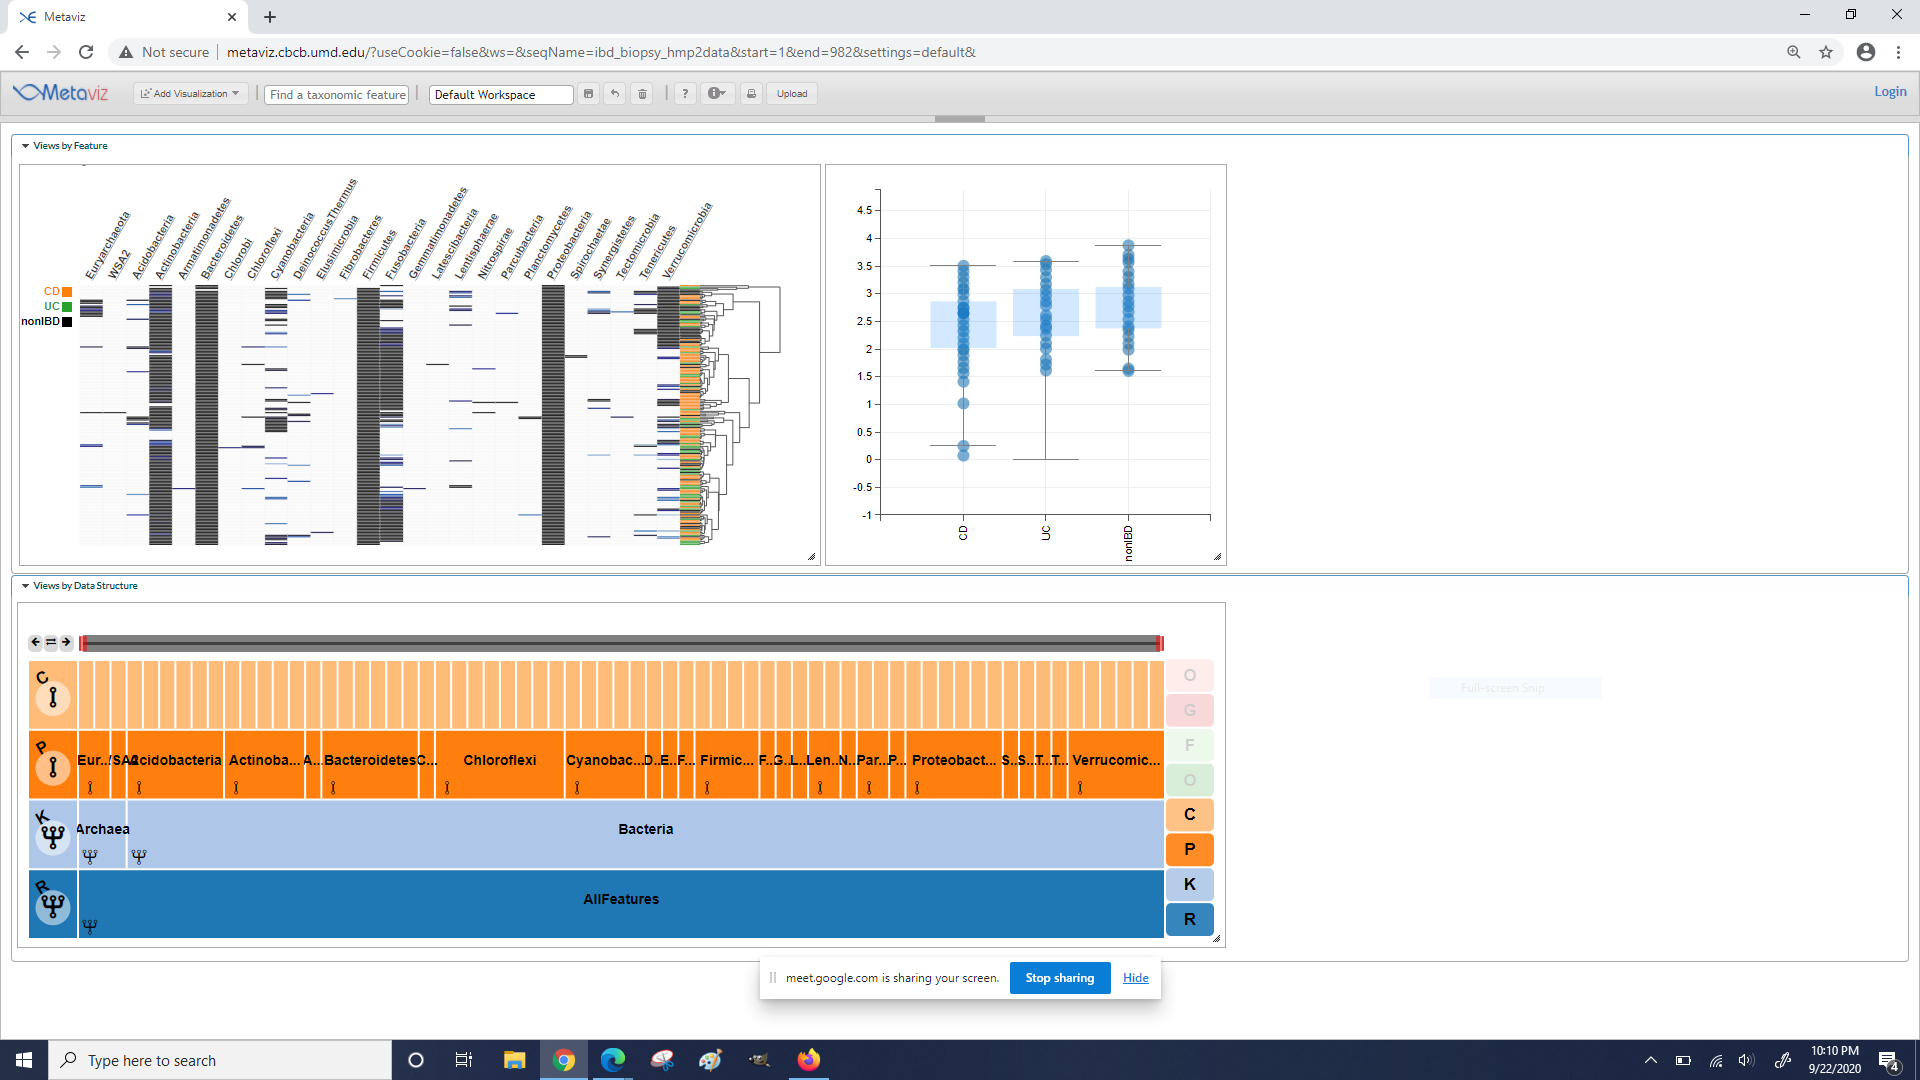
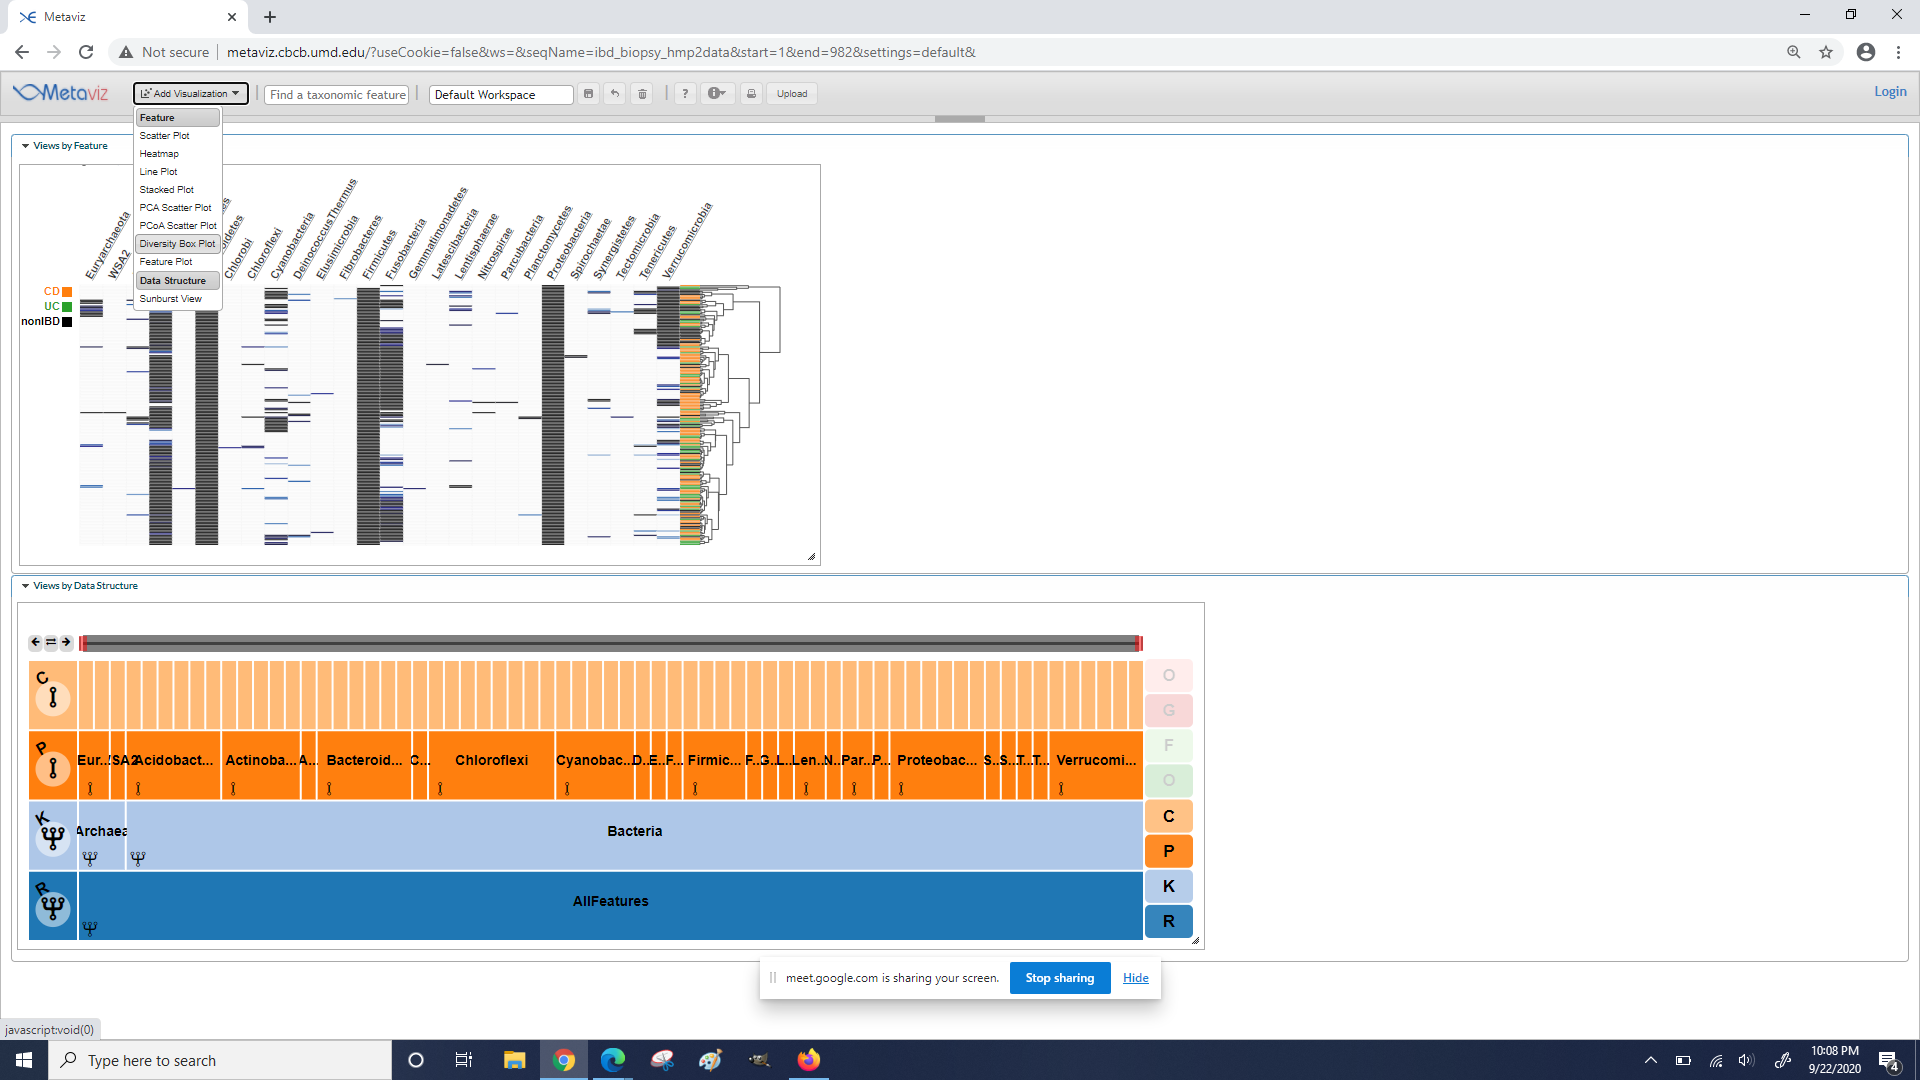
Choose “Add visualization” click “Diversity Box Plot”
Select samples to visualize and click “Ok”
On the Diversity Box Plot click the Settings icon (middle)
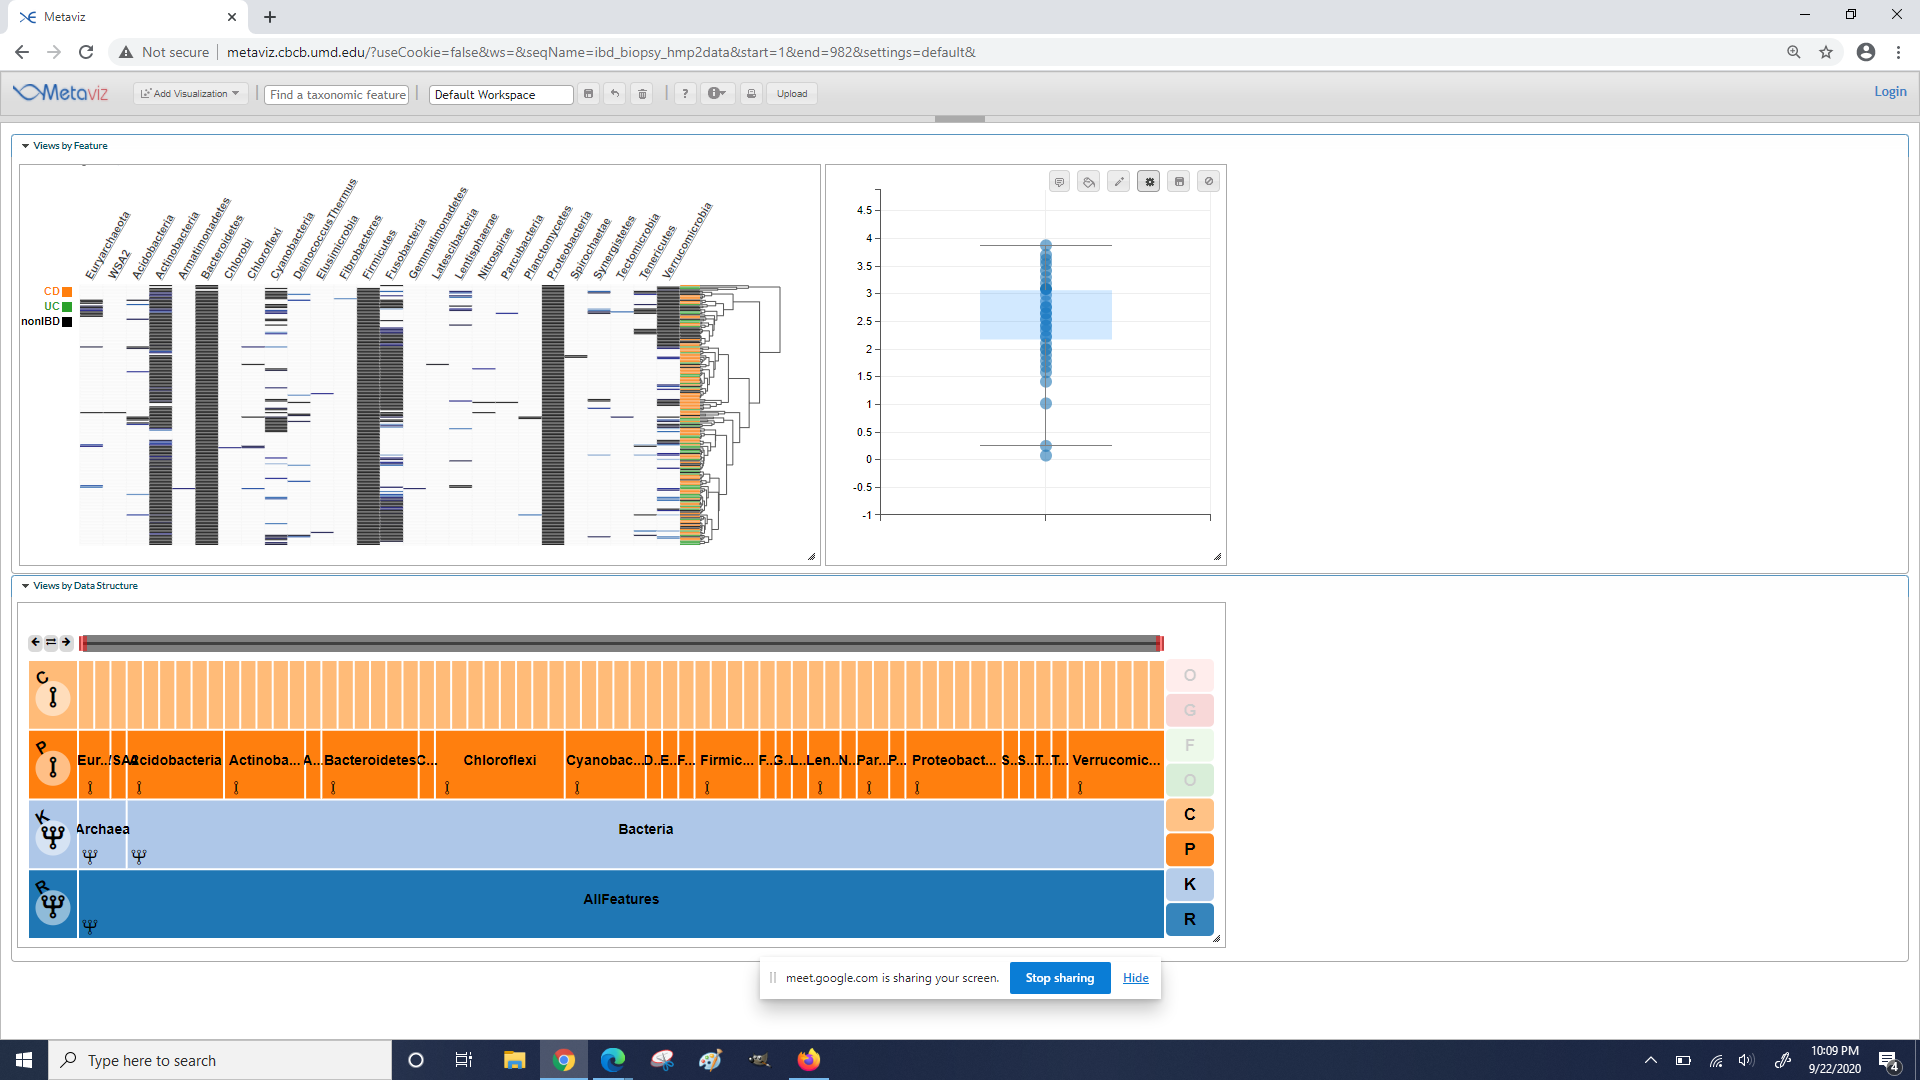
In the Settings menu change “Plot Label” dropdown menu from “name” to “diagnosis”
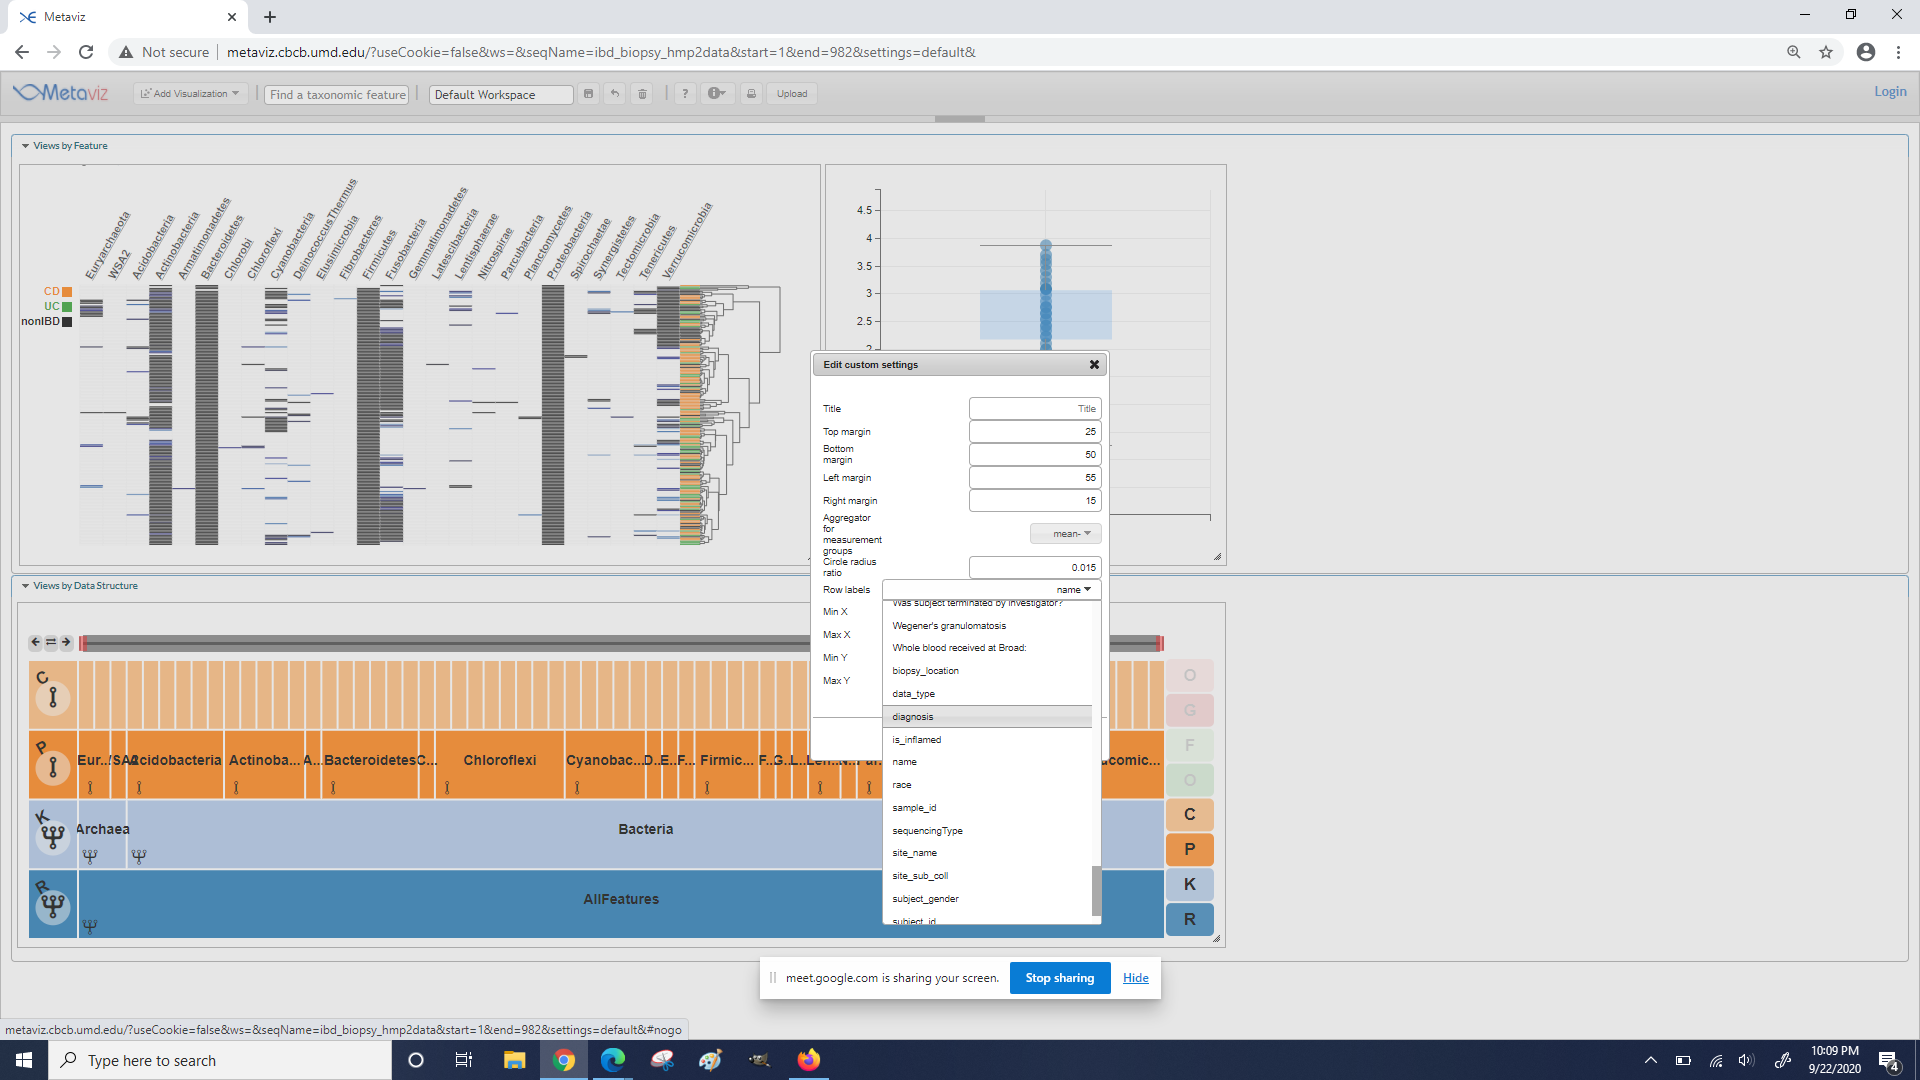
Now the diversity box plot is separated based on the selected field