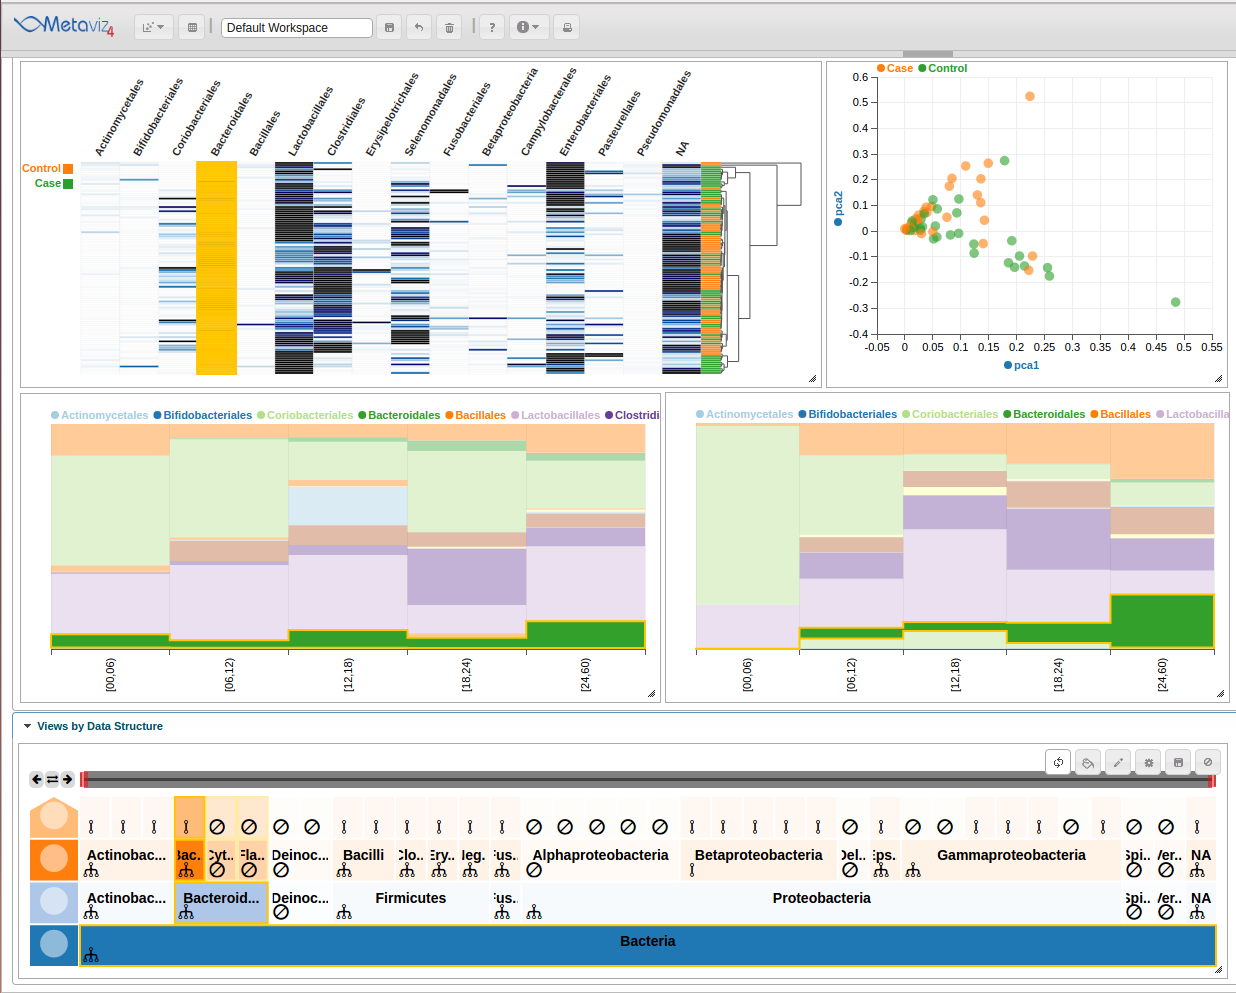
Metaviz is a tool for interactive visualization and exploration of metagenomic sequencing data. Metaviz provides a novel navigation tool for exploring hierarchical feature data that is coupled with multiple data visualizations including heatmaps, stacked bar charts, and scatter plots. Metaviz supports a flexible plugin framework so users can add new d3 visualizations.
The metavizr package implements two-way communication between the R/Bioconductor computational genomics environment and Metaviz. Objects in an R/Bioconductor session can be visualized and explored using the Metaviz navigation tool and plots. Metavizr uses Websockets to communicate between the browser Javascript client and the R/Bioconductor session. Websockets are the protocols underlying the popular Shiny system for authoring interactive web-based reports in R.
A manuscript that describes the Metaviz application and details visual analysis results is available at NAR.
metavizR is an R package that handles metagenomics datasets from an R session to the metaviz app.
Epiviz is an interactive visualization tool for functional genomics data.
epivizR is an R/Bioconductor package that handles genomic data from R session to the epiviz app.
epivizrData manages various bioconductor data types and makes them available to the epivizR and the epiviz app.
epivizrServer is a server management package that creates and manages the websocket session between R and epiviz app.