Now visualizations' code can be customized in the UI, based on user needs!
To do it, simply click on the Edit code button on any of the available charts:

Select the method(s) you want to edit. Only the methods corresponding to this particular instance
of the chart will be modified. For example, in the MA Plot at
http://epiviz.cbcb.umd.edu/4/?ws=S5qde7SD1Je,
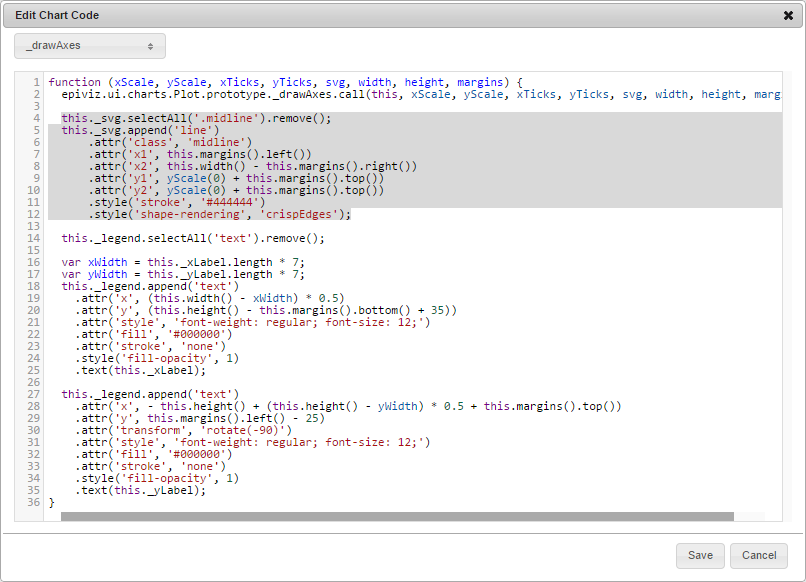
we edited the _drawAxes method by adding the following code at the beginning of the method:
  this._svg.selectAll('.midline').remove();
  this._svg.append('line')
      .attr('class', 'midline')
      .attr('x1', this.margins().left())
      .attr('x2', this.width() - this.margins().right())
      .attr('y1', yScale(0) + this.margins().top())
      .attr('y2', yScale(0) + this.margins().top())
      .style('stroke', '#444444')
      .style('shape-rendering', 'crispEdges');
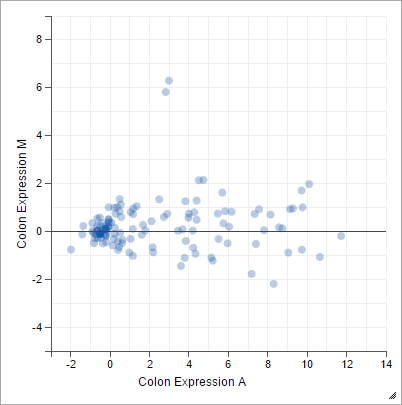
This should add a line at y=0, which is a common view for the MA Plot.
Once happy with the changes, click Save and see the changes take effect immediately:
The changes can be saved in the current workspace!