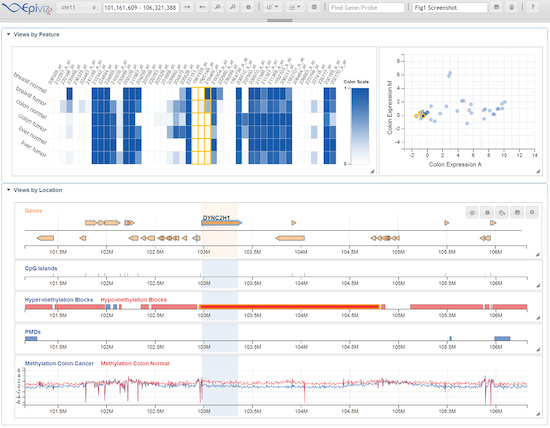
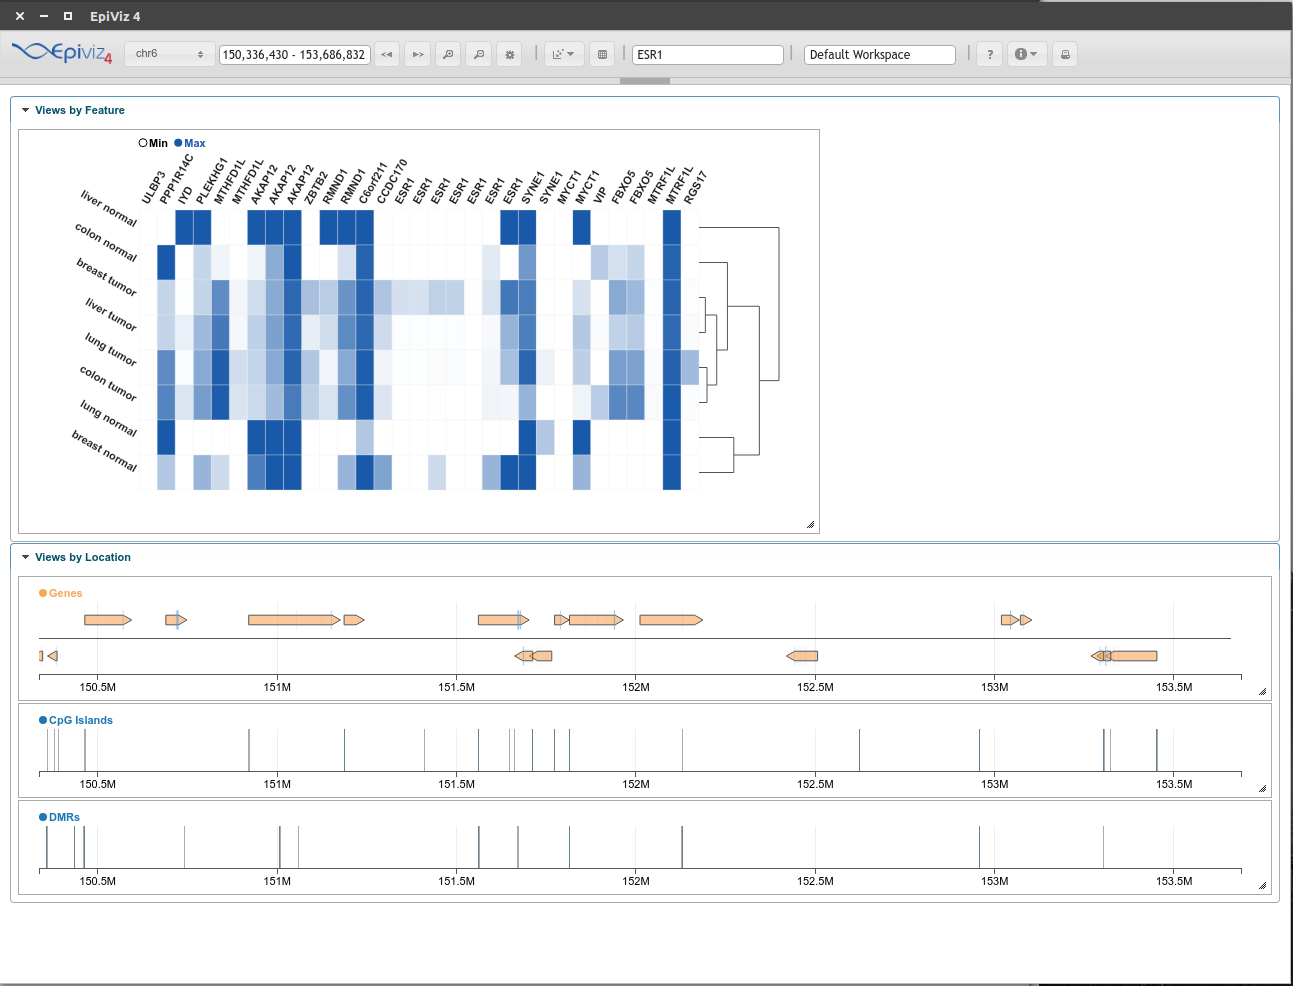
Epiviz is an interactive visualization tool for functional genomics data. It supports genome navigation like other genome browsers, but allows multiple visualizations of data within genomic regions using scatterplots, heatmaps and other user-supplied visualizations. It also includes data from the Gene Expression Barcode project for transcriptome visualization. It has a flexible plugin framework so users can add d3 visualizations. You can see a video tour here.
The
Epivizr Bioconductor package
implements two-way communication between the
R/Bioconductor computational genomics environment and Epiviz. Objects in an
R session can be displayed as tracks or plots on Epiviz. Epivizr uses
WebSockets for communication between the browser
JavaScript client and the
R environment, the same technology underlying the popular
Shiny system for authoring interactive web-based reports in
R.
epivizR is an R/Bioconductor package that handles genomic data from R session to the epiviz app.
epivizrData manages various bioconductor data types and makes them available to the epivizR and the epiviz app.
epivizrServer is a server management package that creates and manages the websocket session between R and epiviz app.